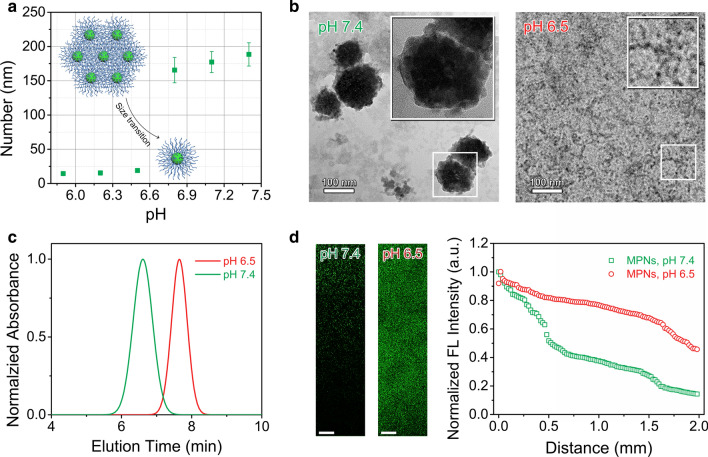
Fig. 3.
Tumor acidity-triggered size transition of MPNs. a Particle size of MPNs at different pH values. b TEM measurements of MPNs treated at pH 7.4 and 6.5. Insert: high magnification TEM image of MPNs. The NPs and MPNs were stained with 2 wt % phosphotungstic acid. c Gel permeation chromatography analysis of MPNs treated at pH 7.4 and 6.5. d Penetration profile of FITC-labeled MPNs (left panel) into the collagen hydrogel and normalized fluorescent intensity (right panel) of FITC-labeled MPNs in collagen hydrogels at pH 7.4 and 6.5. Scale bars: 125 μm

