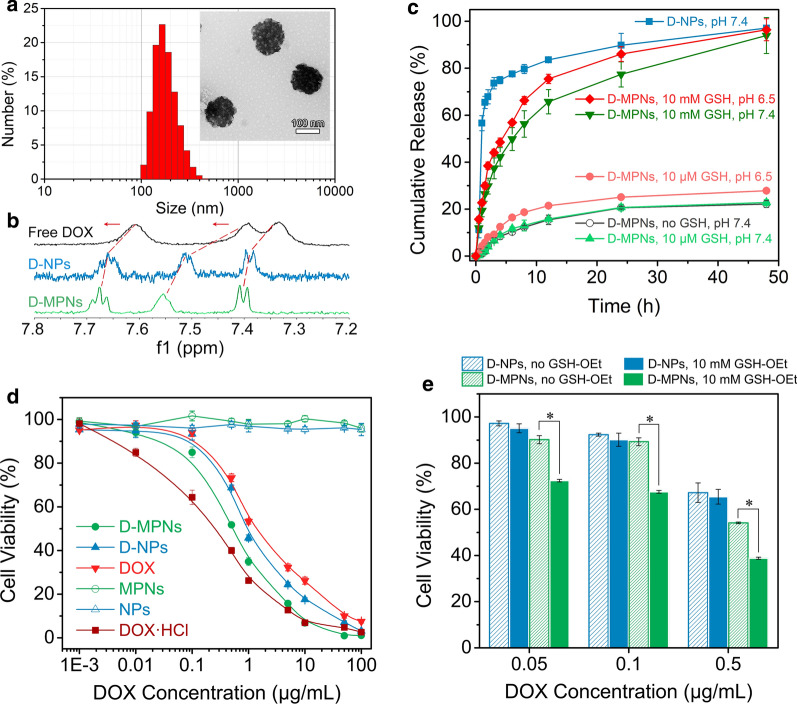
Fig. 4.
a Size distribution and TEM image (the insert) of D-MPNs. Scale bar: 100 nm. b Expansions of the 1H NMR spectra (600 MHz, D2O) of free DOX (top), D-NPs (middle) and D-MPNs (bottom). c Release of DOX from D-MPNs (100 μg mL−1) at different conditions mimicking physiological environments (means ± SD, n = 3). d Viabilities of 4T1 cells after treatment with NPs, MPNs, DOX, D-NPs and D-MPNs for 48 h (means ± SD, n = 5). e Proliferation inhibition of 4T1 cells incubated with D-NPs and D-MPNs at various DOX concentrations for 48 h. The cells were pretreated with 10 mM GSH-OEt for 2 h. The cells non-pretreated with GSH-OEt were used as control, (*p < 0.05)

