Fig. 5.
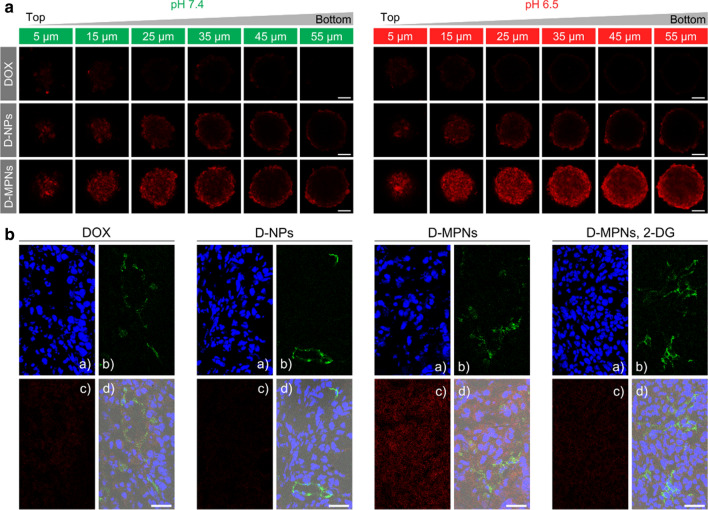
In vitro and in vivo drug penetration D-MPNs. a CLSM images of 4T1 multicellular tumor sections at a distance of 5, 15, 25, 35, 45 and 55 μm from the spheroid rim. The MTSs were incubated with DOX, D-NPs and D-MPNs in the culture media at pH 7.4 or 6.5 for 2 h (DOX concentrations: 5 μg mL−1). Scale bars: 50 μm. b CLSM image of 4T1 tumor sections after administration with DOX, D-NPs and D-MPNs for 12 h at a DOX dosage of 10 mg kg−1. Nuclei were stained by Hoechst 33,342 (a, blue) and blood vessels by FITC-CD31 (b, green). DOX fluorescence was visualized in red (c) and the merged imaged in (d). Scale bars: 30 μm

