
Figure 1: County jail incarceration rates and distribution of maximum change in incarceration rate in the USA, 1987–2017.
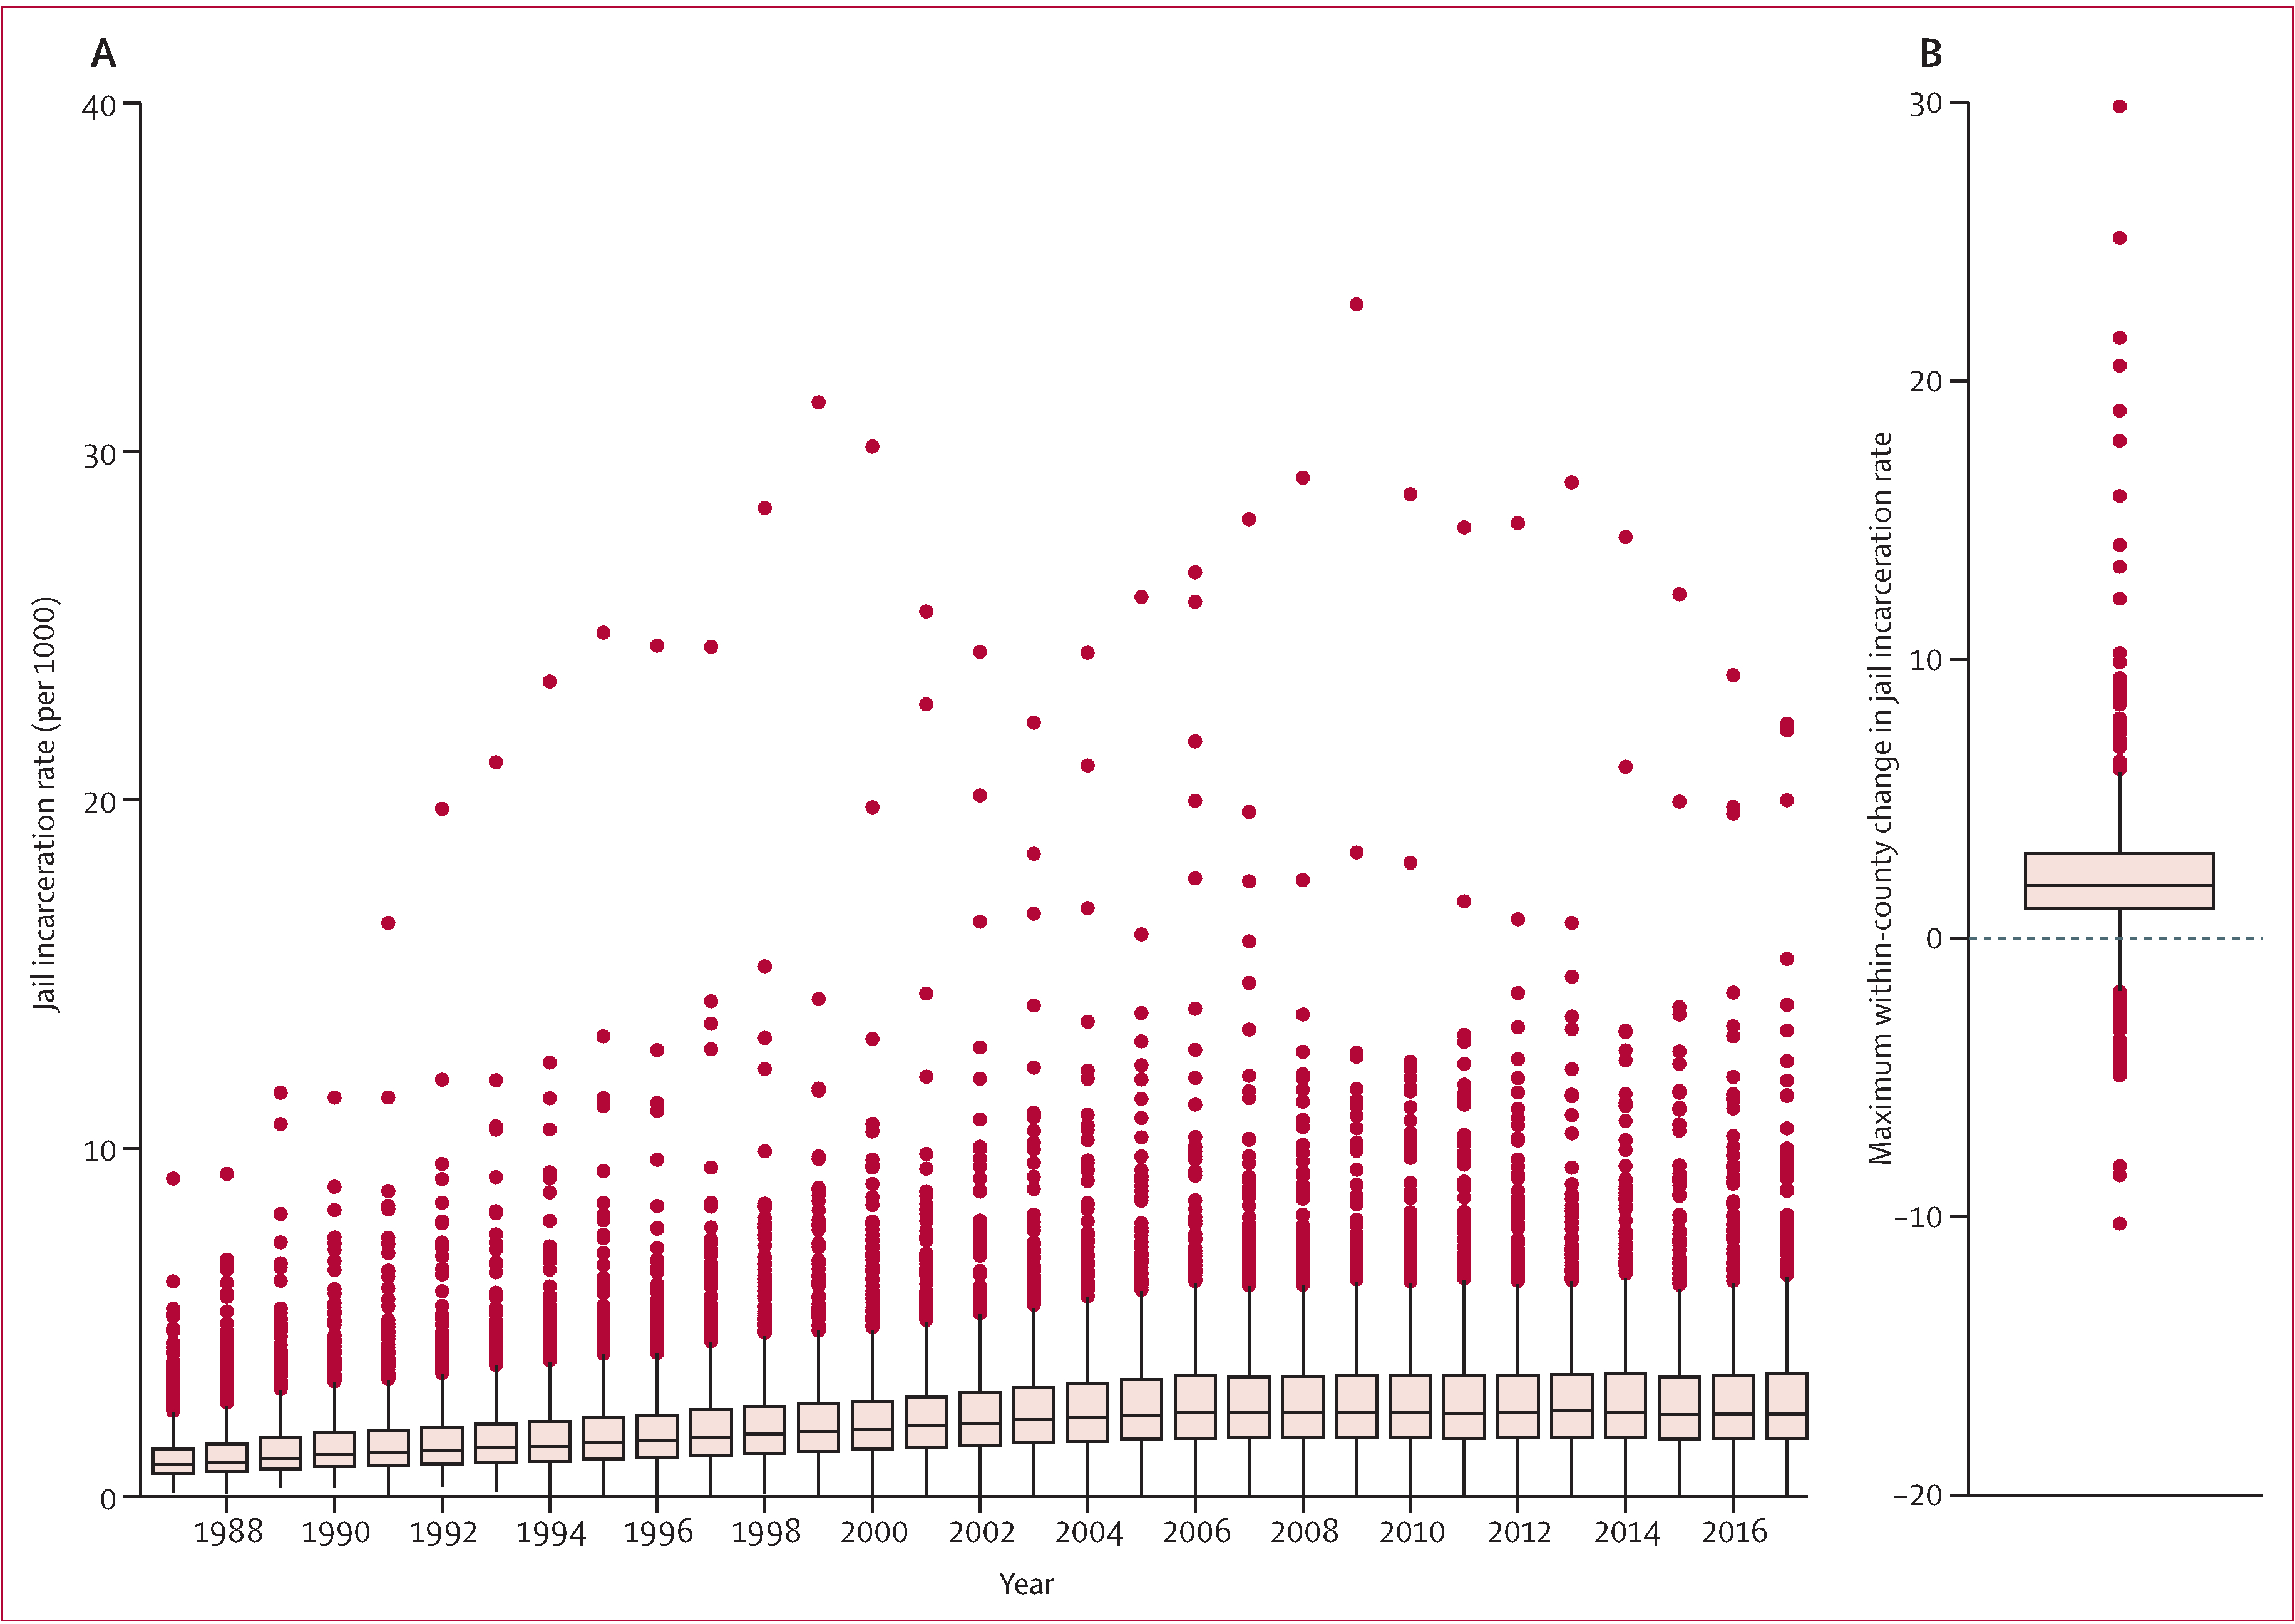
(A) Annual distribution of county jail incarceration rate (per 1000 people in the population) for the 1094 counties in the final analysis. (B) Distribution of each county’s maximum change in jail incarceration rate (positive if the change represents an increase over time and negative if the change represents a decrease over time). The line represents the median and the box represents the IQR.