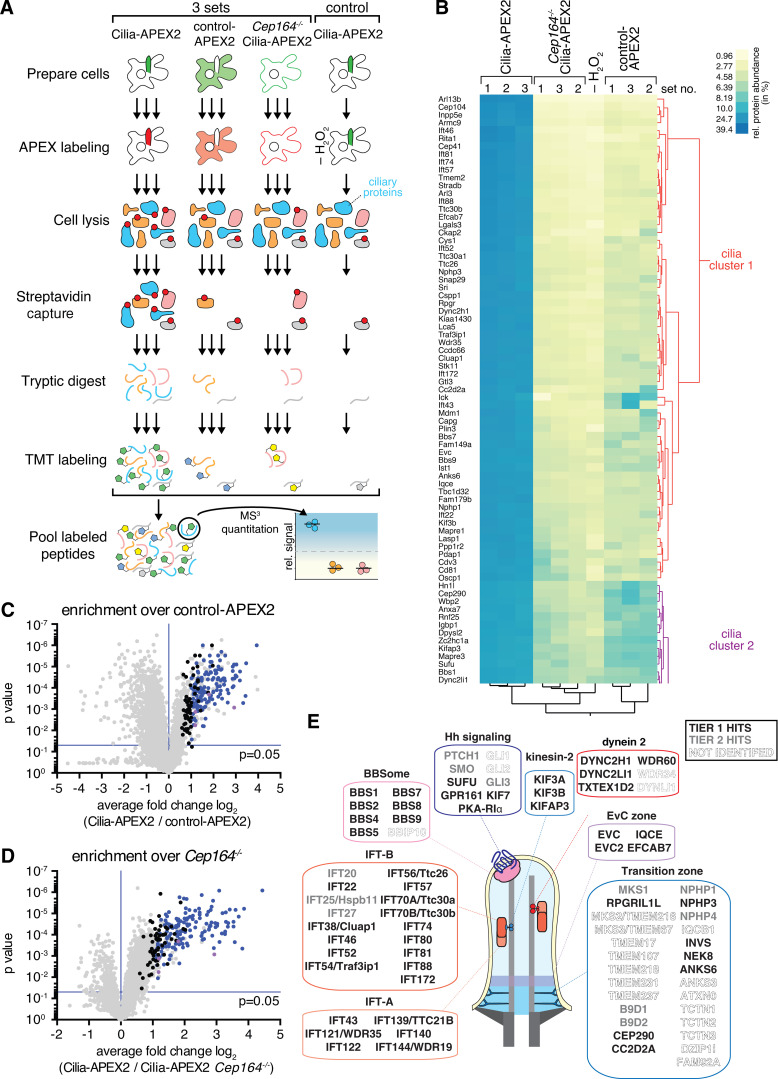
Figure 2.
Cilia-APEX2-based deep proteomics. (A) Workflow of a Cilia-APEX2/TMT experiment. Cells were grown in serum-rich medium for 48 h and switched to low serum for 24 h before conducting APEX labeling by preincubating cells with biotin tyramide for 30 min and adding H2O2 for 2 min before quenching. Cells were lysed, biotinylated proteins (marked with red dots) were isolated on streptavidin resin, and bound material was eluted via on-bead digest with trypsin. For each individual sample, peptides were labeled with a unique TMT. All samples were then pooled and peptides were analyzed using a synchronous precursor selection MS3 method for mass spectrometric identification and quantitation. All samples were in triplicate, except for a technical control, where H2O2 was omitted. (B) Hierarchical two-way cluster analysis of a Cilia-APEX2/TMT experiment. Clustering of the relative abundances of each identified protein (rows) in the individual samples (columns) was performed based on Ward’s minimum variance method. The relative abundance of a given protein was calculated by dividing the TMT signal in one sample by the sum of TMT signals in all samples. The color scheme of relative abundances is shown on the right (in percent). Only the clusters containing cilia proteins are shown (see Fig. S1 E for full cluster analysis). (C and D) Volcano plots of statistical significance versus protein enrichment in Cilia-APEX2 compared with control-APEX2 samples (C) or in Cilia-APEX2 WT versus Cep164−/− samples (D). Calculated P values (statistical significance of enrichment calculated from unpaired Student’s t tests) for 4,836 quantified proteins were plotted against the TMT ratios of Cilia-APEX2 samples versus the respective controls. Proteins fulfilling all four significance and enrichment criteria are represented by blue dots, proteins meeting three criteria are represented by black dots, and other proteins are shown in gray (see text for details). Protein hits quantified by only one peptide are highlighted in purple. See Table S1. (E) Schematic of a primary cilium with key protein complexes, structures, or pathways. The boxes list proteins identified as tier 1 (black) or tier 2 (gray) hits of the Cilia-APEX2 proteome. Proteins not identified by Cilia-APEX2 are indicated by dashed outline lettering. Gene symbols are included when differing from conventional protein names. Note that Ttc30a1 and Ttc30a2 are grouped into IFT70A/Ttc30a.

