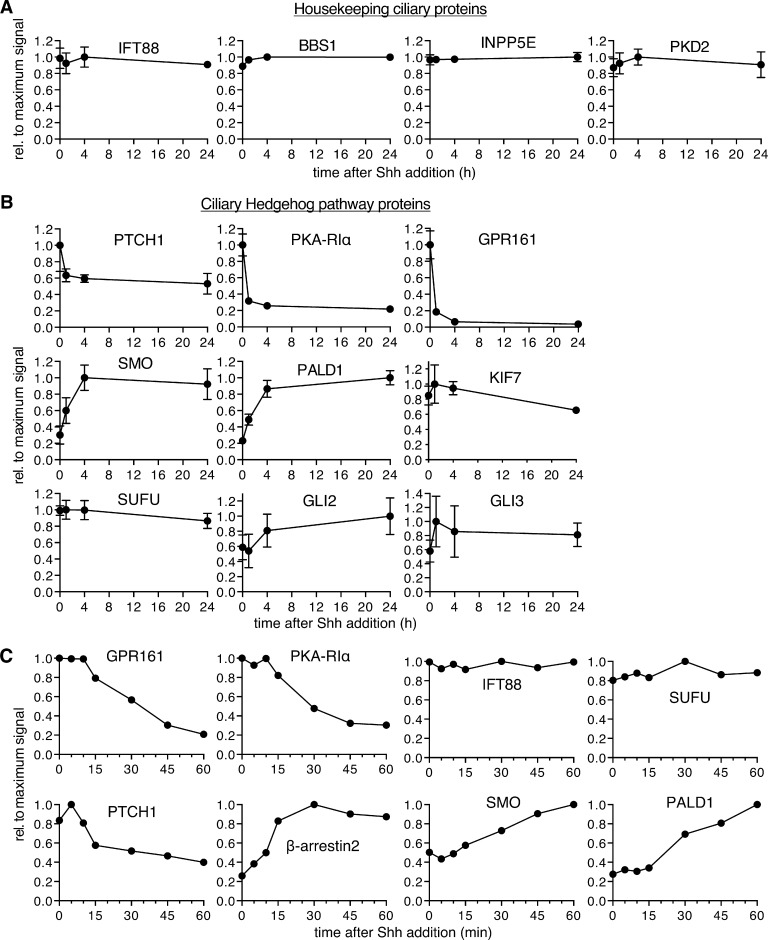
Figure 4.
Time-resolved Cilia-APEX2 proteomics reveals the extent of ciliary proteome remodeling in response to Shh. The relative abundances of selected proteins in the Cilia-APEX2/TMT datasets are plotted against time. For each individual protein, the background signal in the control-APEX2 sample was set to 0 and the maximum average signal across all time points was set to 1. t = 0 corresponds to the −Shh sample. (A and B) 24-h time course. Data points represent averages of duplicate measurements, and error bars depict individual values. Error bars smaller than indicated datapoint symbols have been omitted. 0 h represents −Shh as in Fig. 3 A. Housekeeping ciliary proteins are shown in A. Known and newly identified Hh signaling components are shown in B. (C) 1-h time course. Normalized intensities (relative to ARL13B) were plotted over time. See also Fig. S3.

