Figure 8.
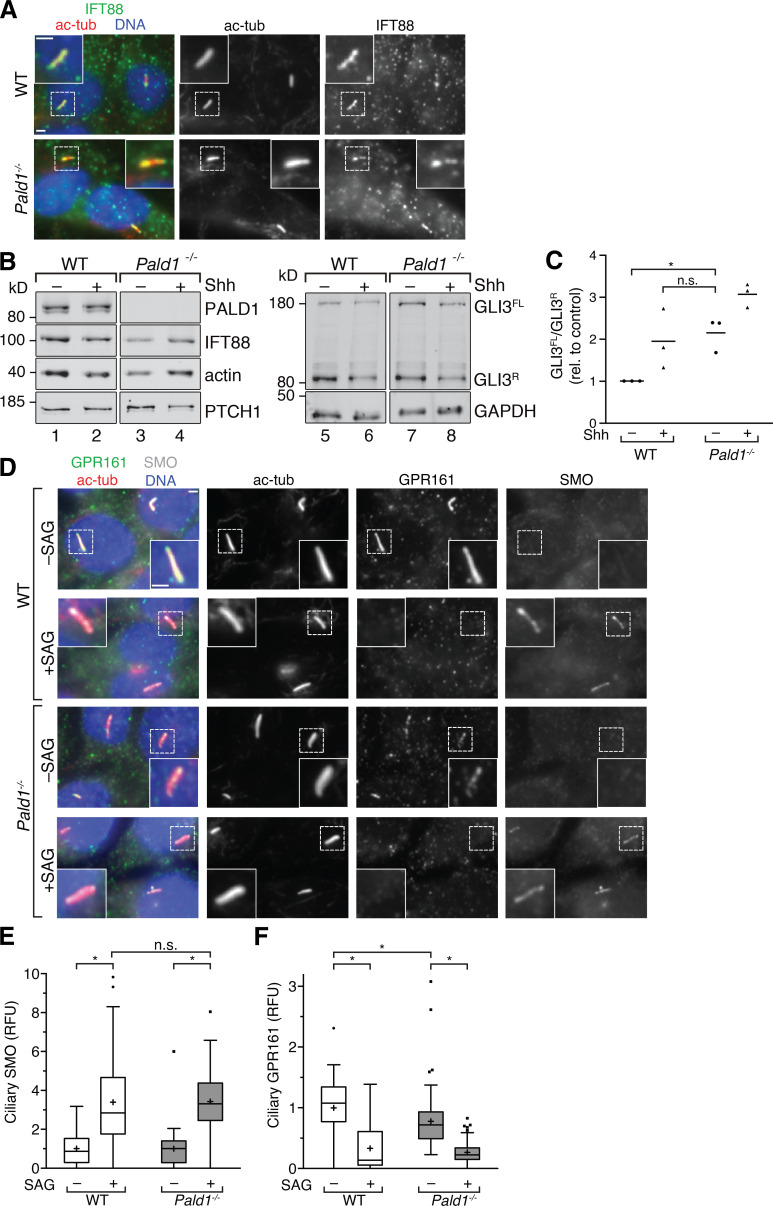
Hh pathway activity is derepressed in Pald1−/− IMCD3 cells. (A) Ciliated WT and Pald1−/− IMCD3 cells were stained for indicated proteins and DNA. (B) WT and Pald1−/− IMCD3 cells treated with or without Shh for 24 h were immunoblotted for the indicated proteins. GLI3 repressor (GLI3R) and full-length (GLI3FL) forms are indicated. (C) GLI3R and GLI3FL signals from three independent experiments as in B were quantified (see Fig. S4) and GLI3FL/GLI3R ratios plotted. Horizontal lines depict means (n = 3). Each experiment was internally normalized to the GLI3FL/GLI3R ratio in WT in the absence of signal (WT –Shh GLI3FL/GLI3R ratio = 1). (D) Ciliated WT and Pald1−/− IMCD3 cells were treated with or without SAG for 24 h and stained for the indicated proteins and DNA. (E and F) Box plots showing background-corrected, relative fluorescence normalized to acetylated tubulin signals. (E) Two independent experiments were performed, and 30 cilia were analyzed per condition in each experiment (n = 60). (F) 30 cilia per condition were analyzed from three independent experiments (n = 90). Data were analyzed using two-way ANOVA with multiple comparisons in a Tukey test with a defined confidence of 95%. *, P < 0.05; n.s., not significant. All scale bars represent 2 µm. In box plots, crosses indicate mean values, whiskers indicate values within 1.5× interquartile range, and dots represent outliers.

