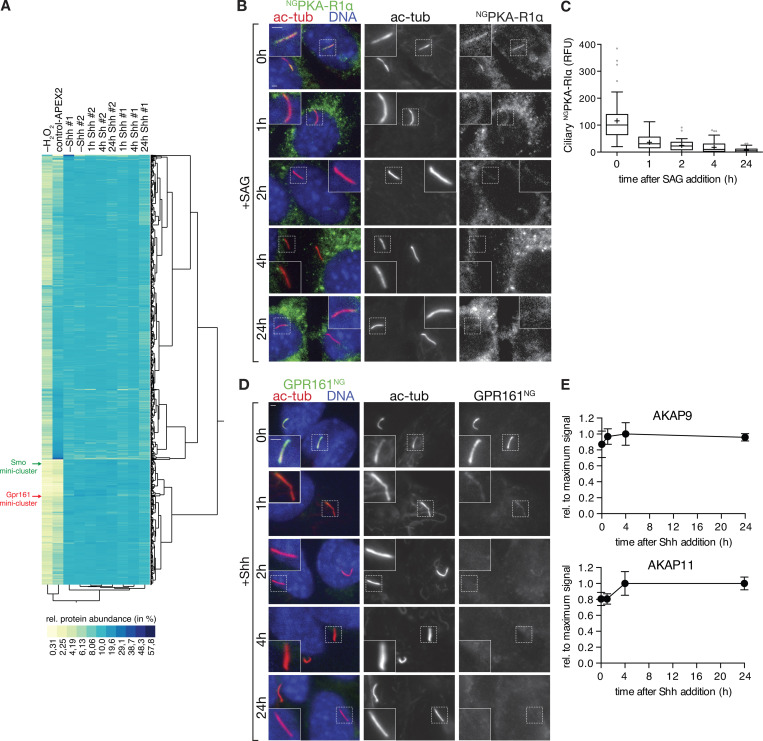
Figure S2.
Hh pathway activation removes PKA-RIα and GPR161 from cilia, but not the AKAPs identified by Cilia-APEX2. (A) Two-way hierarchical cluster analysis (Ward’s method) of the relative protein abundances (rows) in the individual samples (columns) shows high inter-set reproducibility. Legend depicts the color scheme of relative abundances (calculated as in Fig. S1 E). SMO and GPR161 miniclusters are indicated by green and red arrows, respectively (see Fig. 5, A and B for magnified views of the miniclusters). (B and C) Ciliated NGPKA-RIα–expressing IMCD3 cells were treated with or without SAG for the indicated times. (B) Cells were fixed and stained for acetylated tubulin (ac-tub; red) and DNA (blue). NGPKA-RIα was visualized by NG fluorescence. (C) Box plot shows background-corrected NGPKA-RIα fluorescence in cilia at indicated time points after SAG addition. 50 cilia (n = 50) were analyzed per time point. (D) Ciliated IMCD3 cells expressing GPR161NG were serum-starved for 24 h in the presence of Shh for indicated times and analyzed as in B. GPR161NG was detected by NG fluorescence. For quantitative analysis, see Fig. 5 F. (E) Relative AKAP abundances assessed by mass spectrometric TMT quantitation were plotted over time. Data points represent averages of duplicate measurements, error bars depict individual values. Maximum average signal was set to 1, and background signals as assessed from control-APEX2 labeled samples were set to 0. 0 h represents −Shh. Scale bars, 2 µm. In box plots, crosses indicate mean values, whiskers indicate values within 1.5× interquartile range, and dots represent outliers.

