
Figure 3.
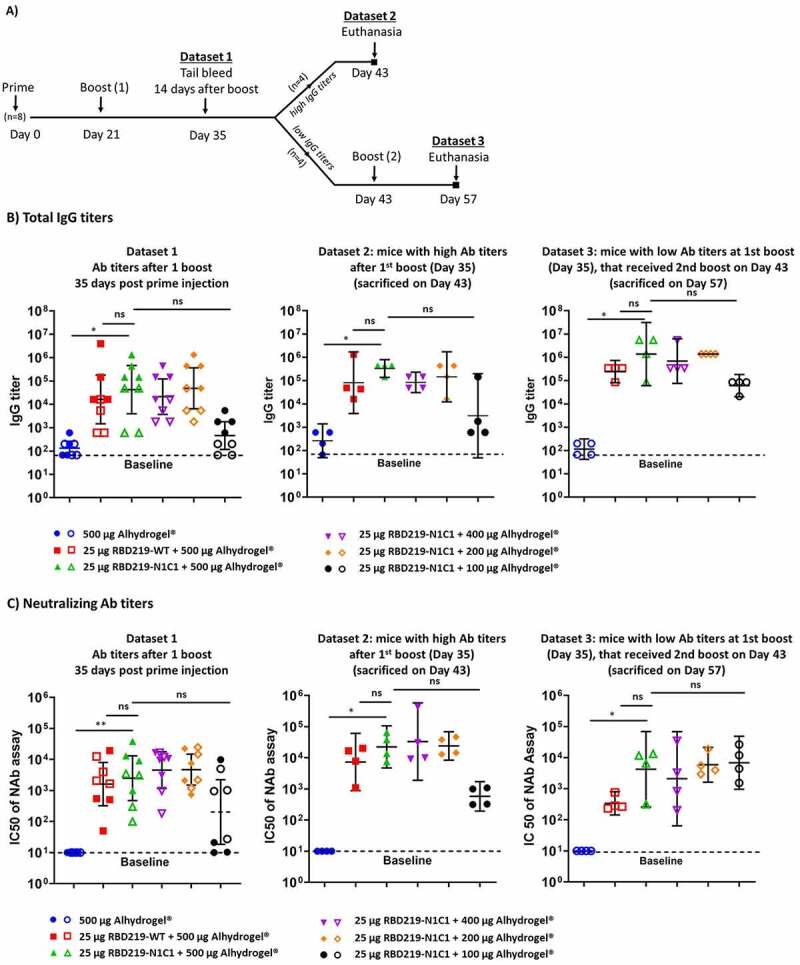
(A) Study design. (B) Total IgG titers of Datasets 1, 2, and 3 measured, respectively, at days 35, 43, and 57 post the prime injection. IgG titers were determined against RBD219-WT protein. Closed data points represent data from mice with the highest IgG titers (Dataset 2), open data points represent data from mice with the lowest IgG titers (Dataset 3). (C) IC50 values measured by a pseudovirus neutralization assay. Datasets 1, 2, and 3 are measured, respectively, at day 35, 43, and 57 after the first injection. Baselines indicate the lowest dilution measured. Lines on each group represent the geometric mean and 95% confidence intervals