
FIG. 1.
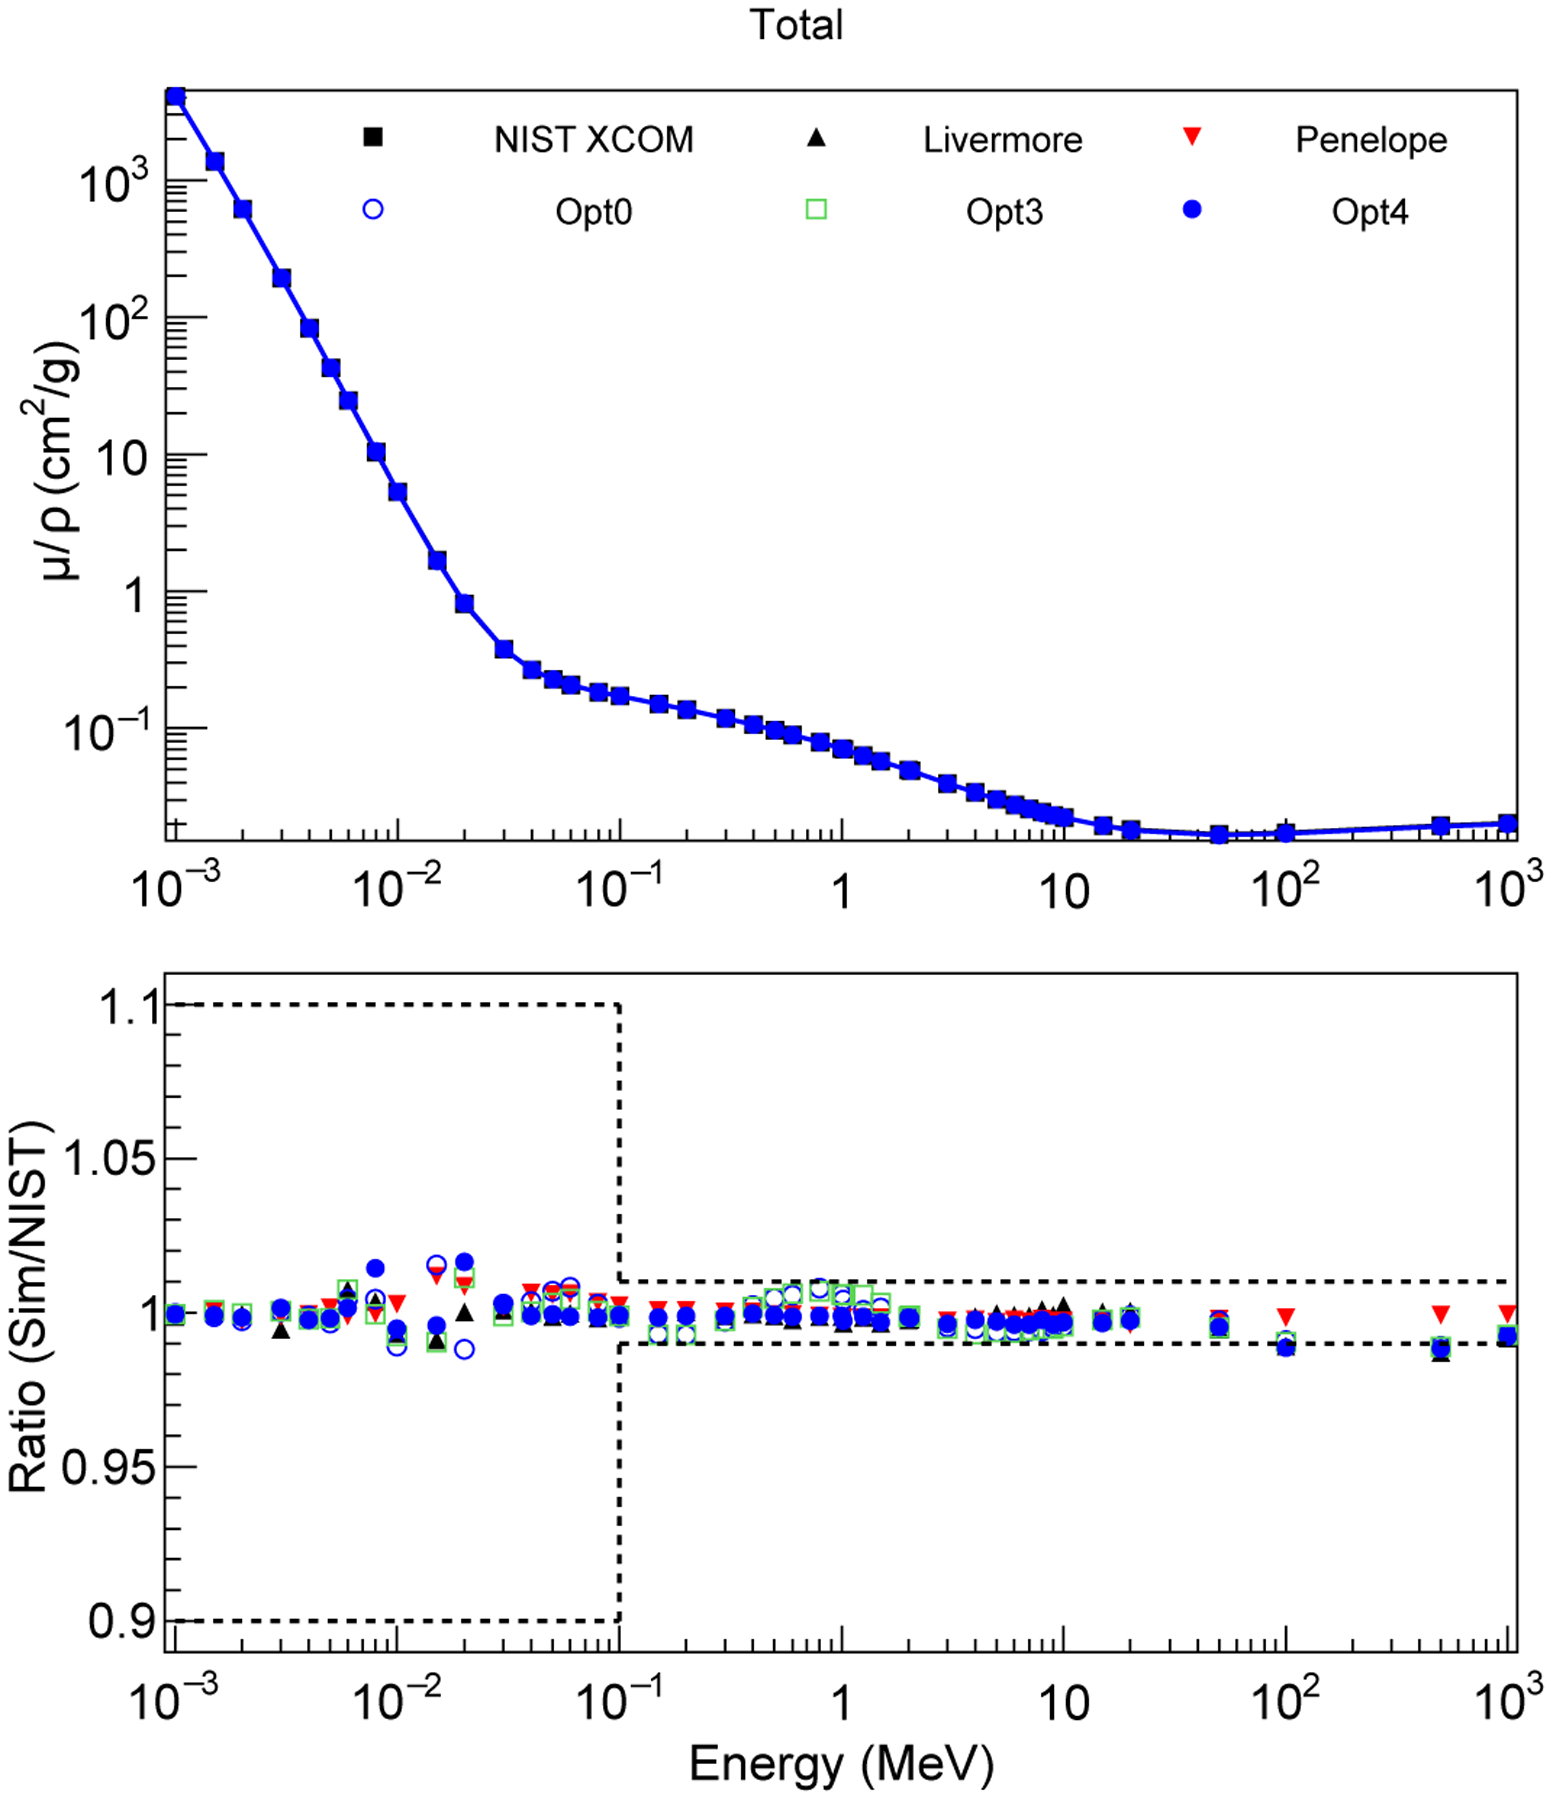
Top plot: Total attenuation coefficient in water with respect to the photon energy. Bottom plot: Ratio of the results obtained with Geant4 and the NIST XCOM reference data. The black dashed lines in the bottom plot represent the uncertainties of the NIST XCOM data (σref). The statistical uncertainty affecting the Geant4 simulation results is below 1%.