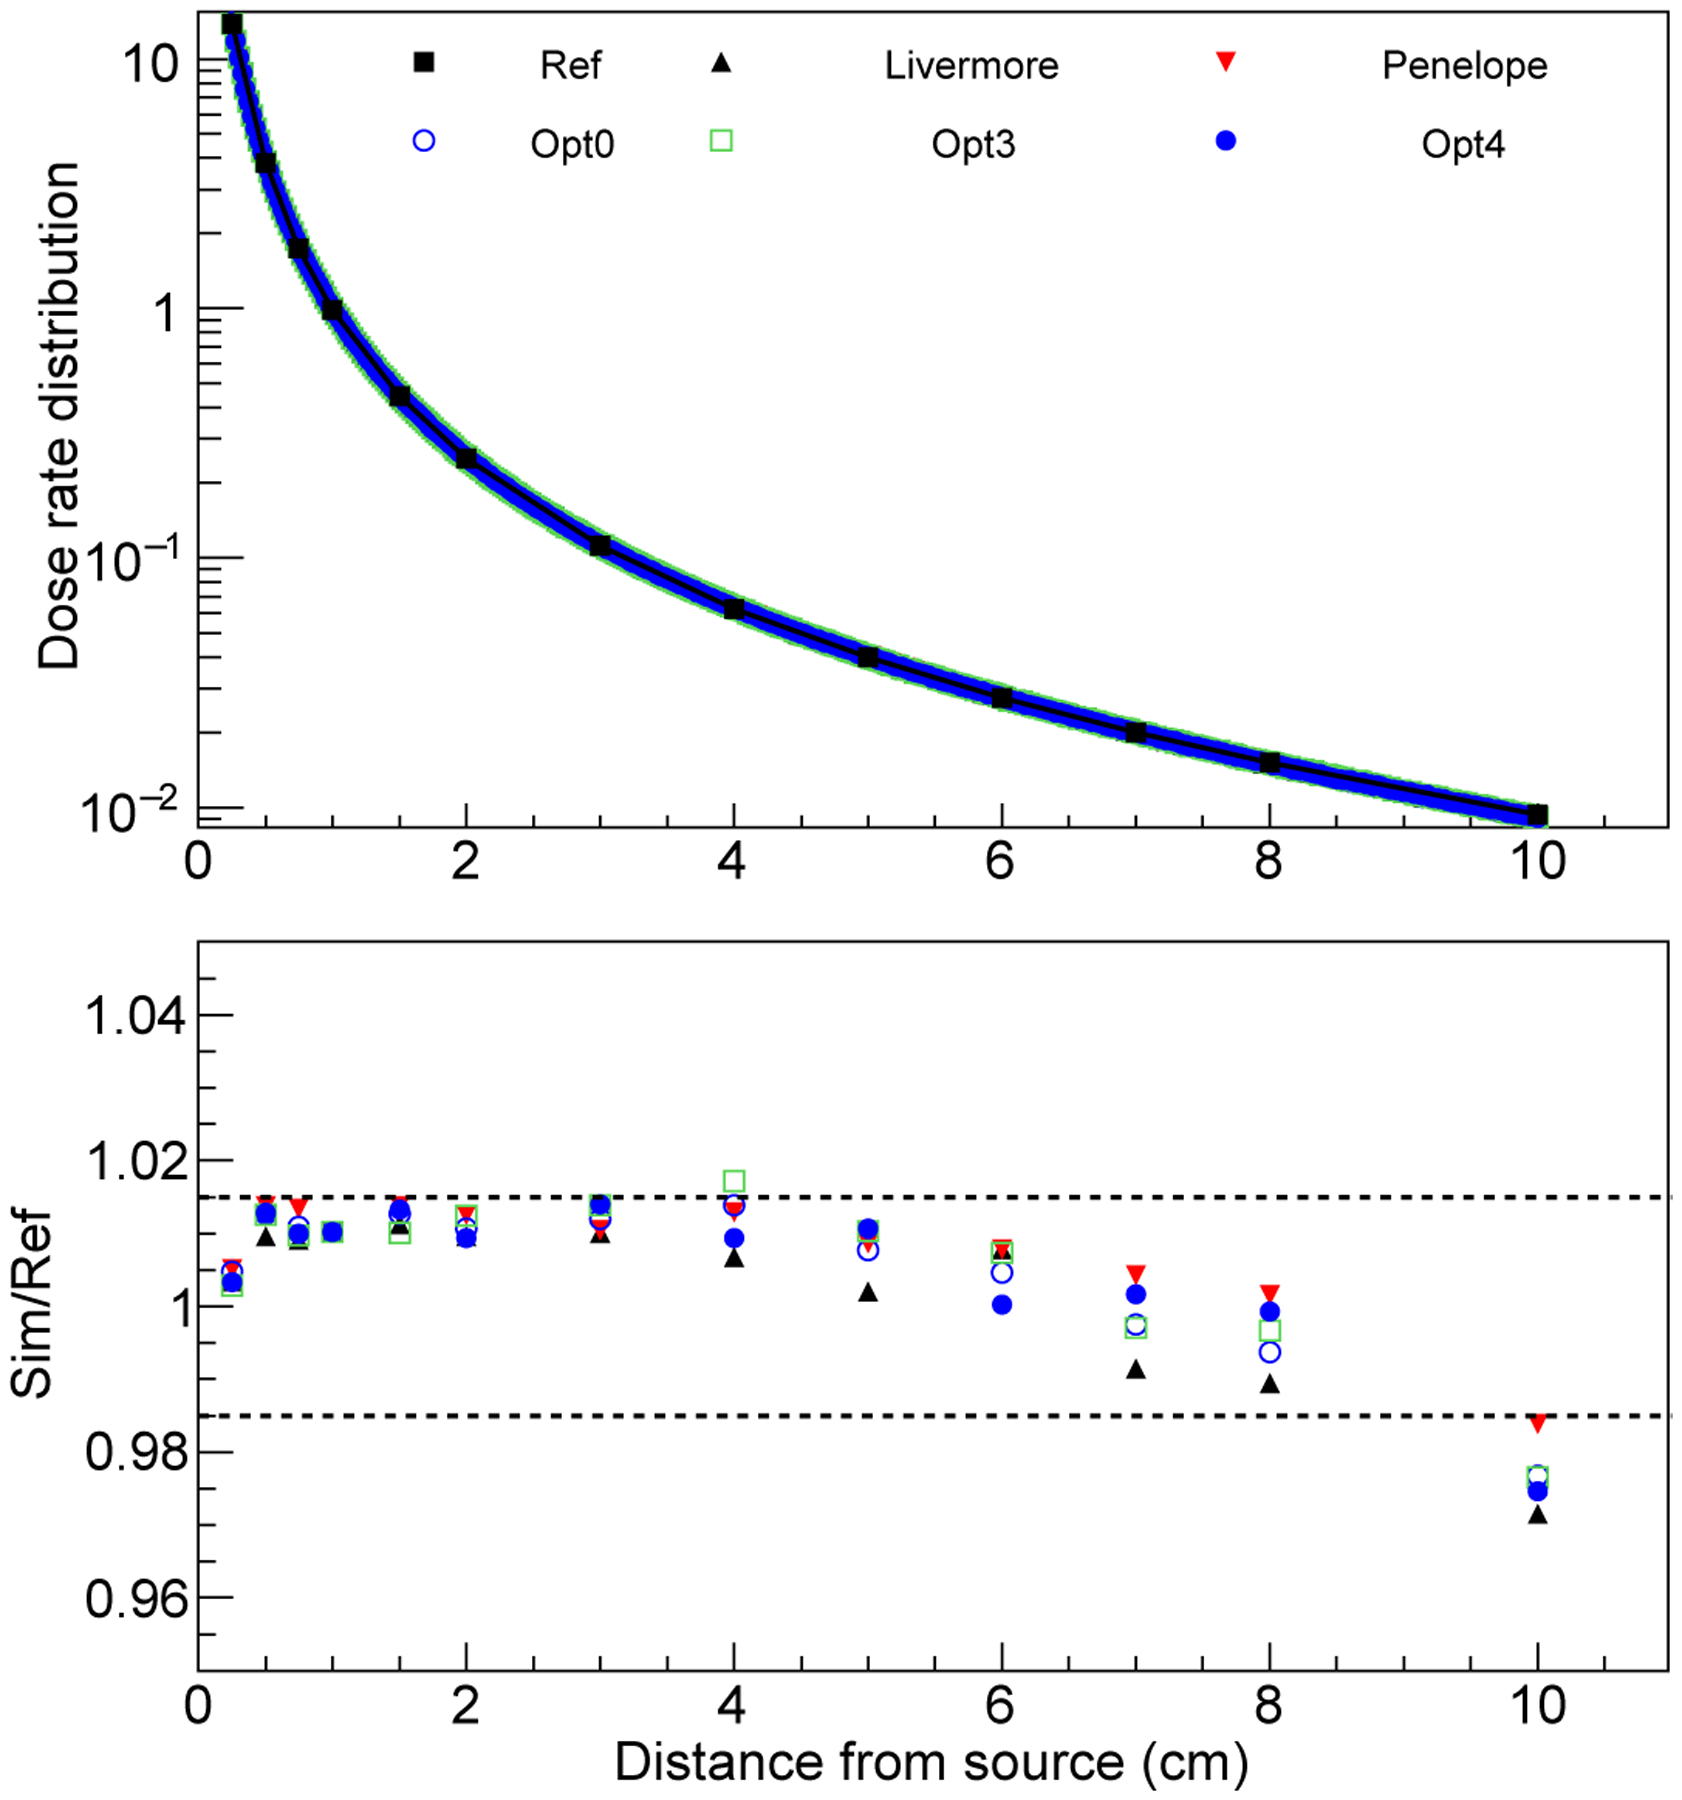
FIG. 11.

Radial dose rate distribution with respect to r, distance from the center of the 192Ir brachytherapy source. The radial dose distribution is normalised at r=1 cm. Black squares in the top figure represent the reference data (from Granero et al 2006 [83]), the statistical uncertainties of the data are within the symbols. The bottom plot shows the ratio of the Geant4 simulation results and the reference data. The dashed lines indicate the statistical uncertainty affecting both the simulation results obtained with Geant4 10.5 and the reference data published in Granero et al 2006 [83], obtained with Geant4 7.1.
