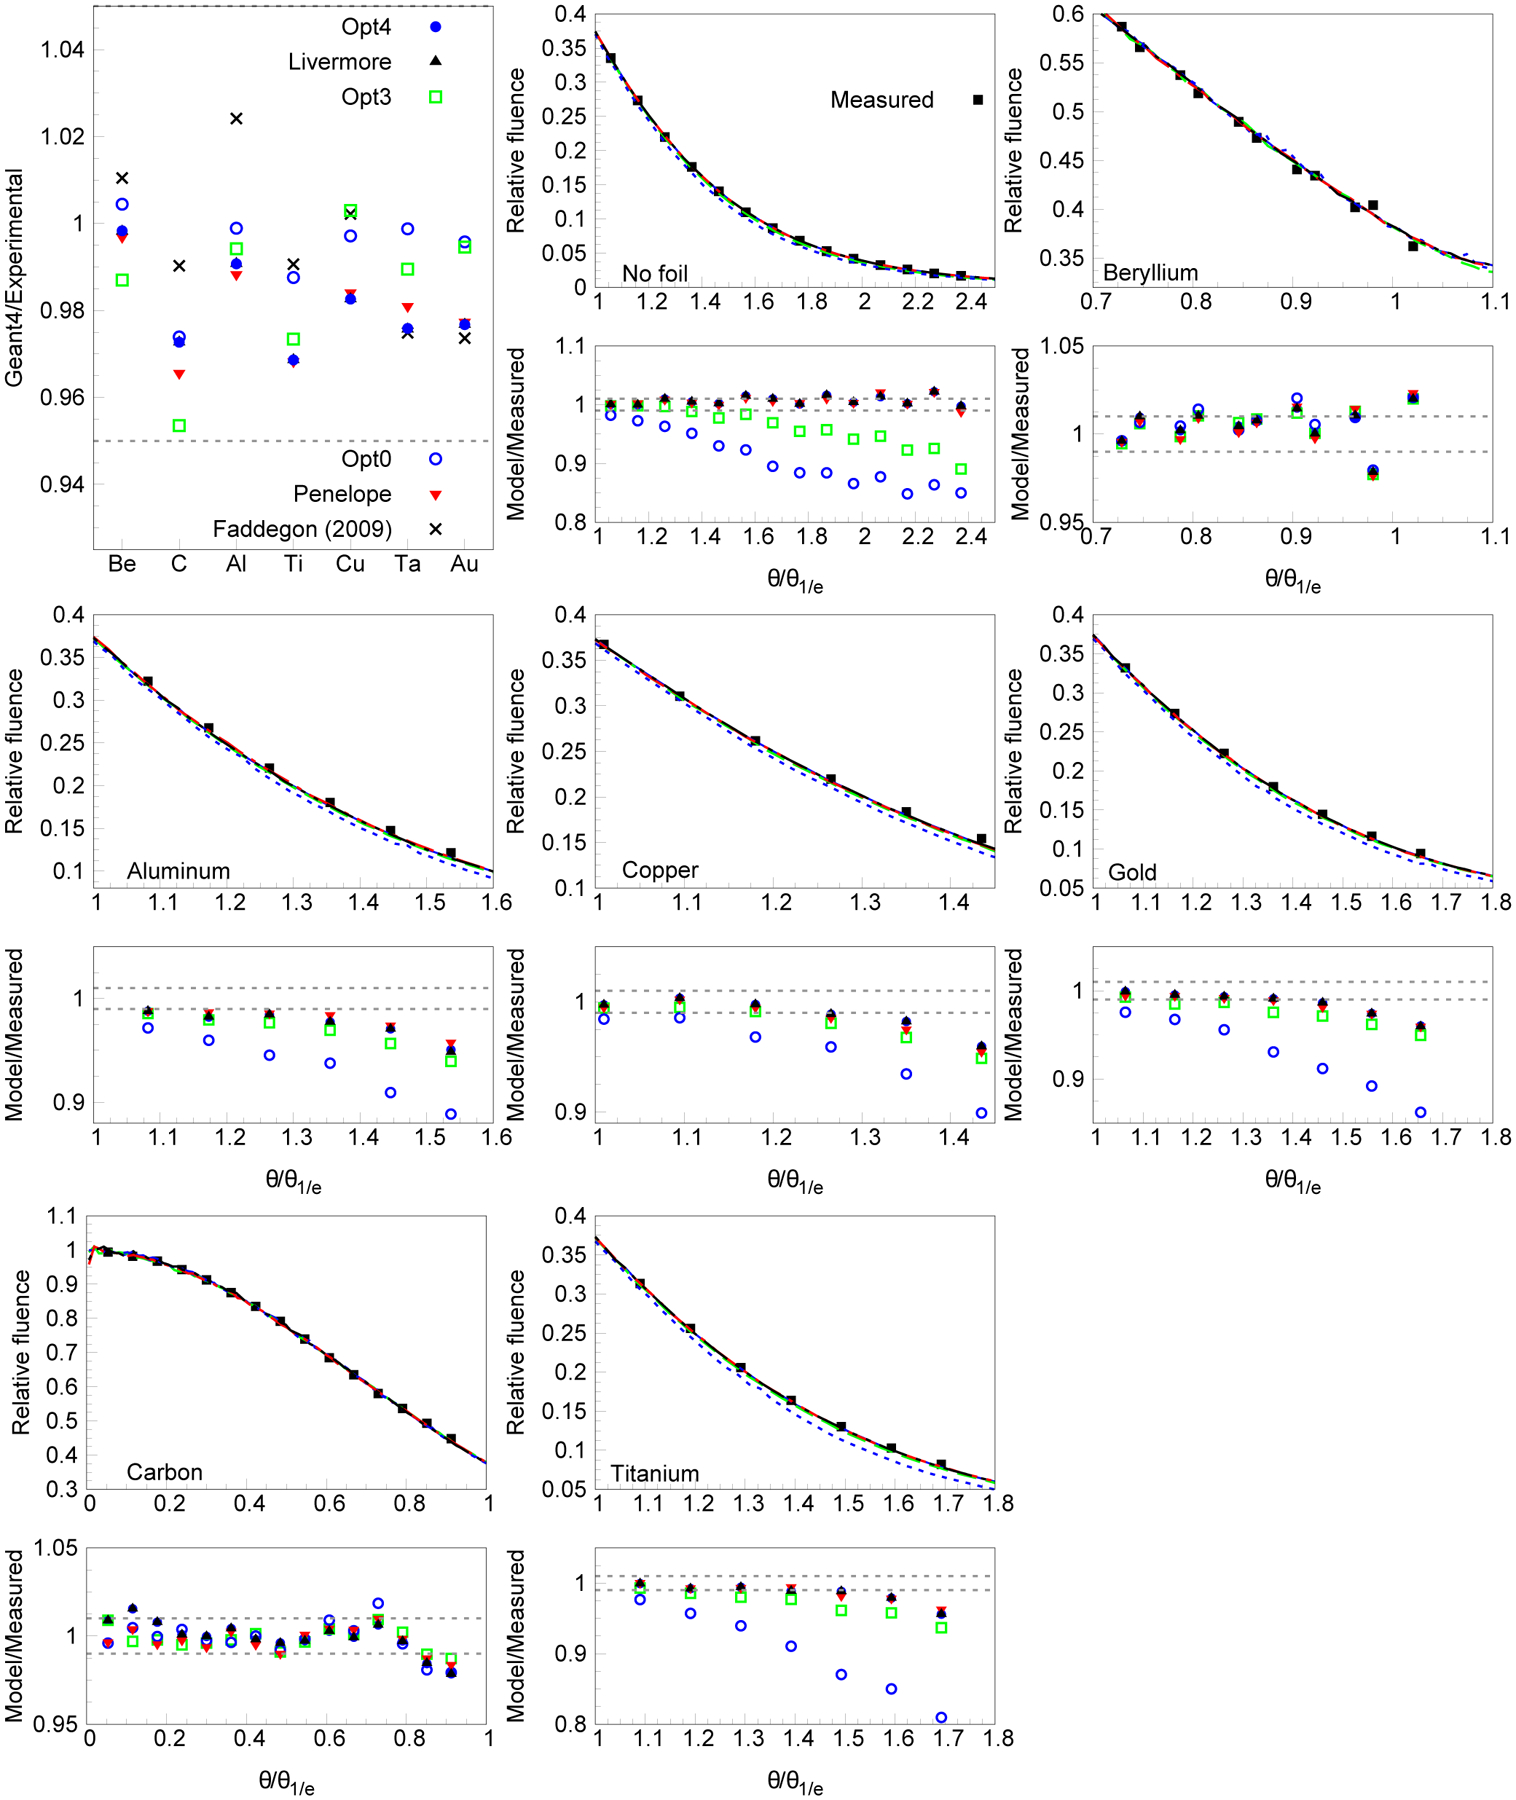
FIG. 6.

Ratio of calculated characteristic angle to that measured by Ross et al. 2008 [61] for all foil materials (top left), the calculated data from (Faddegon et al 2009 [18]) were obtained with Geant4 9.2. The measured angular distribution normalized to unity on the beam axis for select foils at points near or beyond the characteristic angle θ1/e are also shown (symbols) compared to calculated results (lines). The gray dashed lines in the plot represent the experimental uncertainties, 1 standard deviation (σref). The statistical uncertainties of the simulations are within 1%.
