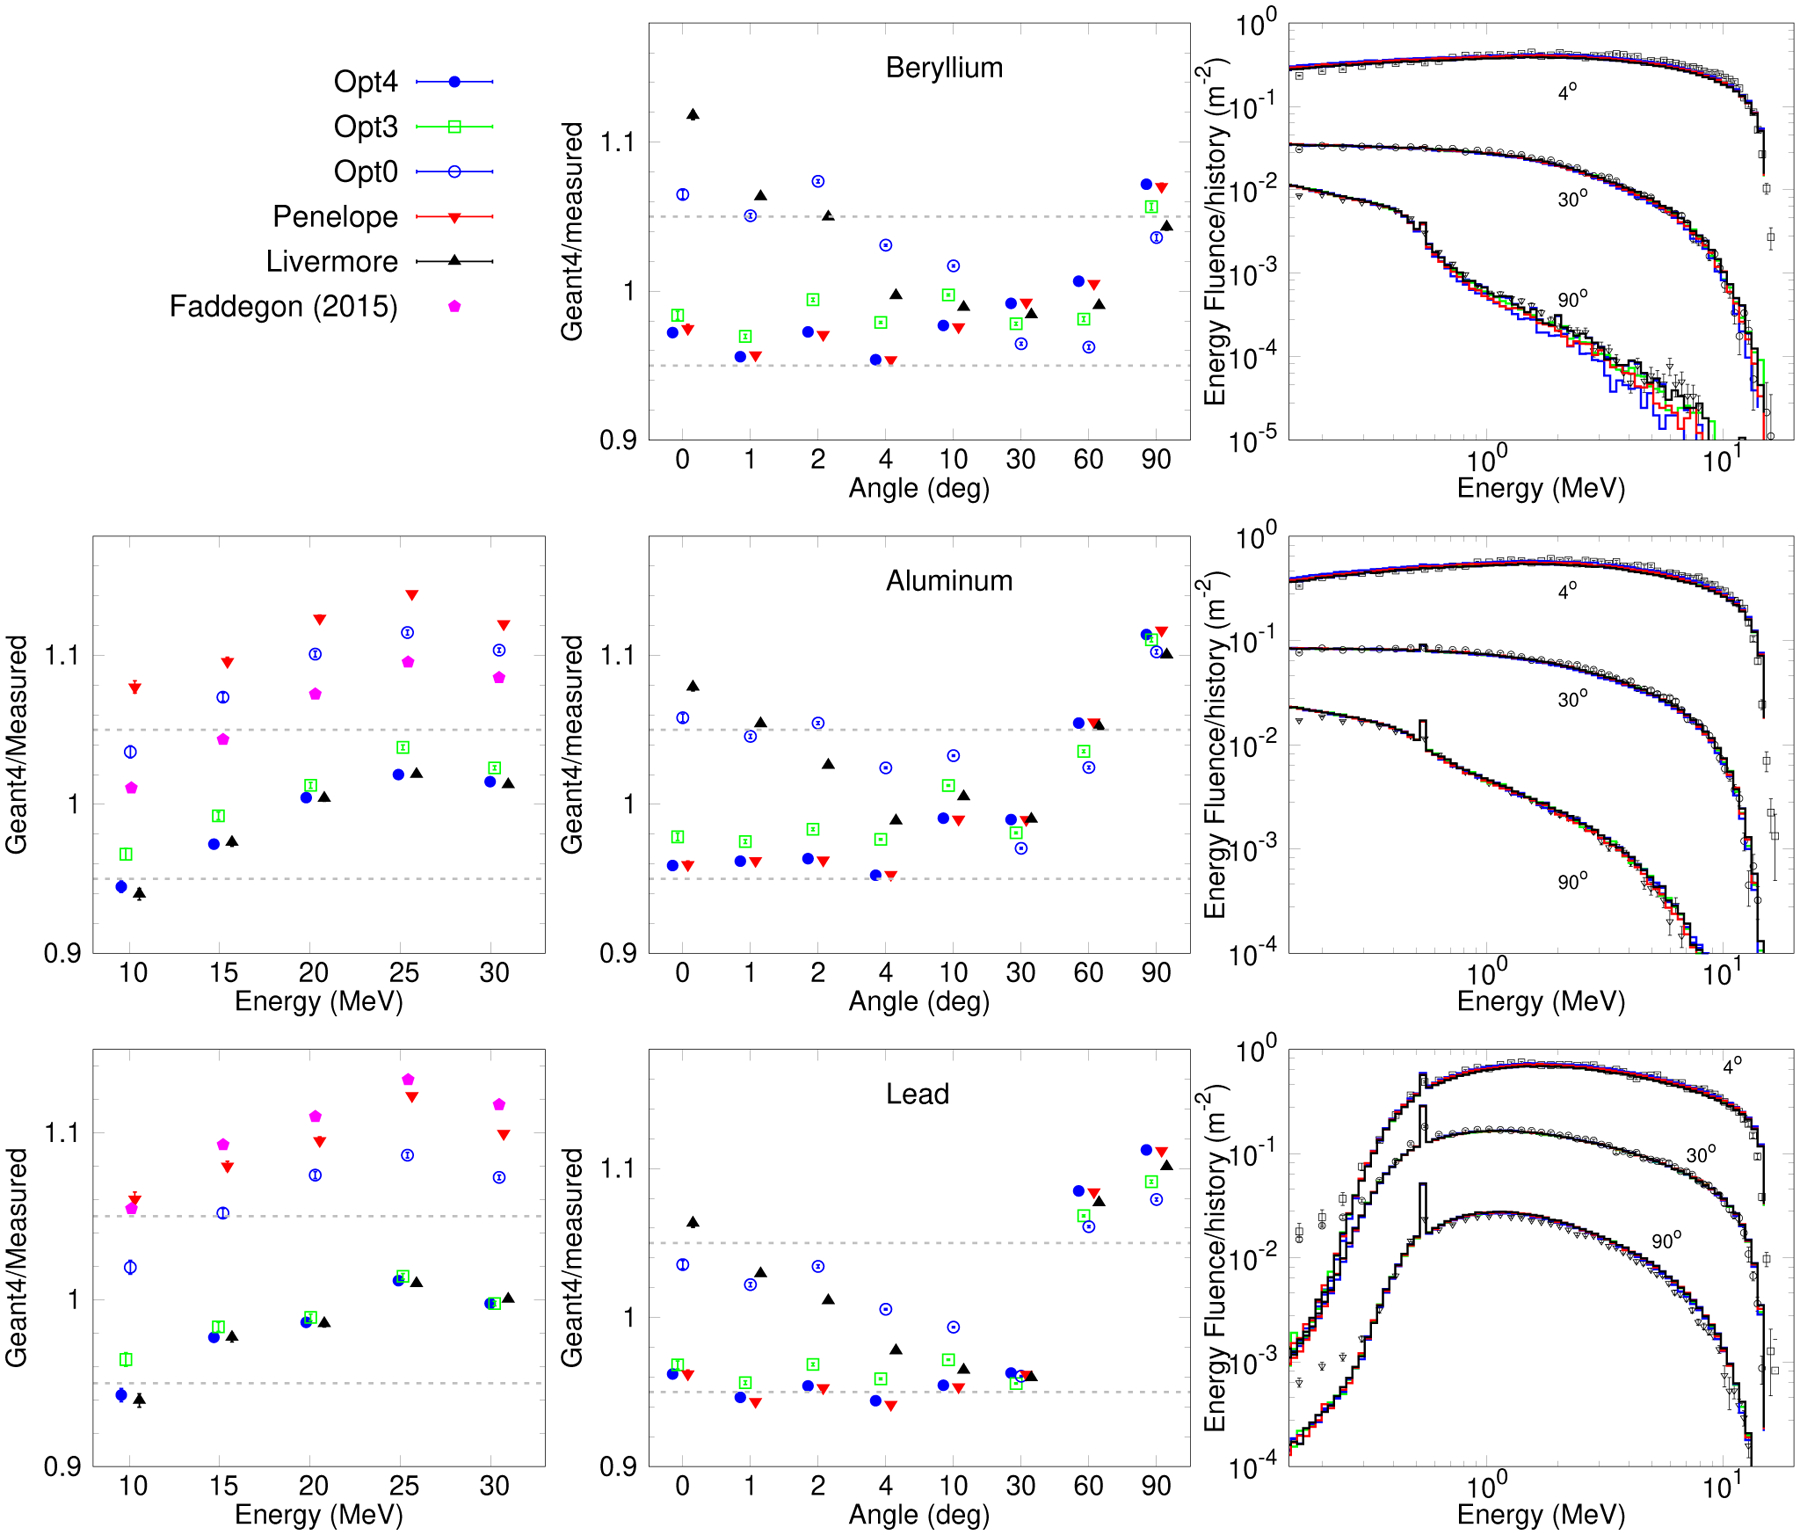
FIG. 7.

Bremsstrahlung from thick targets of beryllium (top), aluminum (middle) and lead (bottom). Ratio of simulated to measured 10–30 MeV bremsstrahlung yield on the beam axis (left) for aluminum and lead targets, including published results (Faddegon et al 2008 [19]) from an earlier version of Geant4 (left), ratio of simulated to measured 15.18 MeV bremsstrahlung yield from 0–90° (center) and spectral distributions of energy fluence at 15.18 MeV and representative beam angles of 4°, 30° and 90° (right). The measured spectra are shown with markers. Ratios are displayed at slightly shifted energy and angle for clarity. Associated error bars, in most of the cases smaller than the symbols, represent calculated statistical uncertainties, 1 standard deviation. The gray dashed lines in the plot represent the experimental uncertainties, 1 standard deviation (σref).
