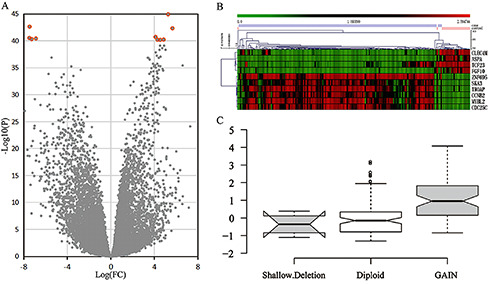
Figure 1.

Summary of EC genome-wide integration analysis based on TCGA and GEO data sets. A) In the screening of DEGs in EC, red circles represent ten significant genes. B) In the TCGA data set, the top ten genes expressed most prominently in EC patients were identified; each column represents a sample, while each row represents the expression level of the gene; the color scale represents the original Z score, ranging from green (low expression) to red (high expression). C) Among the top 10 DEGs, MYBL2 had the most significant CNA in EC, and copy number amplification led to upregulated expression levels of MYBL2.
