Figure 4.

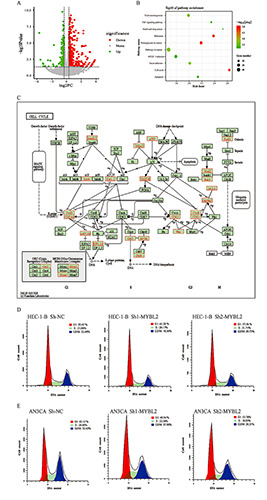
Pathway enrichment analysis of DEGs in MYBL2 knockdown EC cells. A) Analysis of DEGs in EC cell untreated and treated groups. Volcano plots were used to summarize the DEGs. B) Pathway enrichment analysis of the top 10 DEGs; the negative log10 Q value from pathway enrichment analysis is plotted, and the pathways are sorted based on the p-value of DEGs and enrichment based on the core DEG data set. C) Heat map of genes related to the cell cycle. The heat map showed that after knocking out MYBL2, 22 genes in EC cells were significantly differentially expressed. D-E) Cell cycle analysis of EC cells 48 h after transfection with the indicated plasmids.
