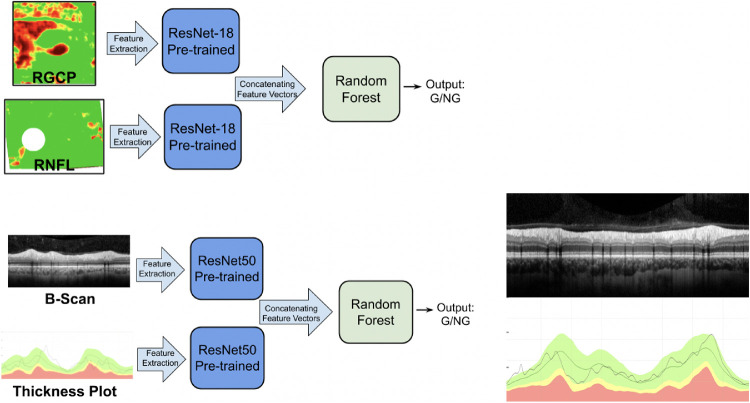
Figure 3.
(A) Schematic showing the multimodal input image (feature concatenation) technique for RNFL + RGCP maps (top left) and for b-scans + thickness plots (bottom left). In each case, features were extracted from each image by a pretrained CNN and concatenated before being classified by a downstream Random Forest classifier. (B) At right is shown the image concatenation technique attempted for b-scans. The b-scans were vertically concatenated with thickness plots; these combined images were provided as input to the CNN.

