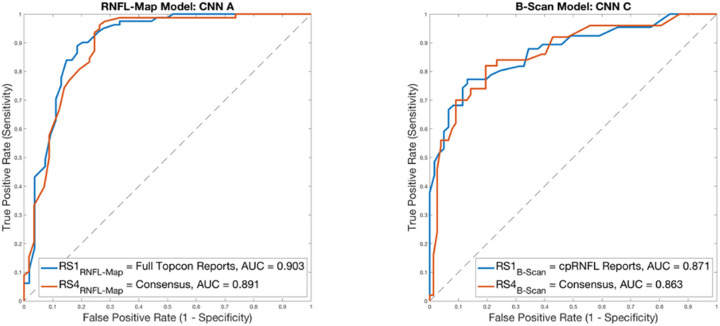
Figure 6.
ROC curves showing impact of RS on model performance. For RNFL map input, the RS with higher AUC is full Hood reports, followed by consensus; for b-scan inputs, the RS resulting in higher AUC is cpRNFL reports, followed by consensus. However, there is no significant difference in AUC for both model types between RS1RNFL-Map/RS1B-Scan and RS4RNFL-Map/RS4B-Scan, respectively (AUC values shown in legends).

