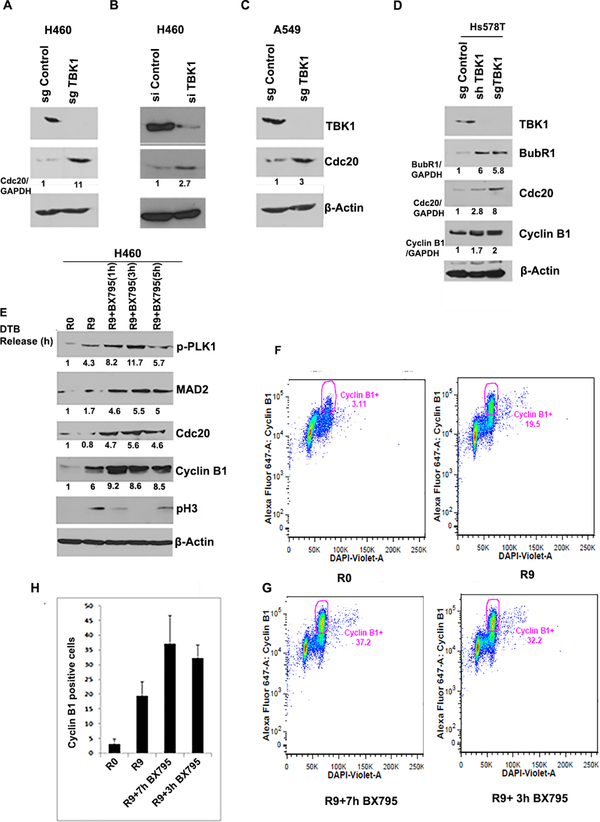
Figure 3: TBK1 depletion and inhibition upregulates expression of SAC components.
(A-B) TBK1 depletion using (A) CRISPR/ Cas9 tool or (B) siRNA results in increased protein level of Cdc20 in H460 cells. (C) TBK1 depletion using CRISPR/ Cas9 tool results in increased Cdc20 protein level in A549 cells. (D) TBK1 was depleted using CRISPR/ Cas9 or shRNA tool in Hs578T breast cancer cell line. Western blot analysis showed an increase in Cdc20, BubR1 and cyclin B1 on TBK1 depletion. (E) H460 cells synchronized at G1/S and released for indicated time period were treated with BX795. Western blot analysis of cell lysates shows that SAC components Cdc20 and MAD2 are increased on TBK1 inhibition. Levels of Cdc20 and cyclin B1 are also increased. Normalized quantification for respective proteins is shown below each lane. (F-G) A549 cells released from a G1/S block were treated with BX795 for 3 or 7 hours. Bivariate flow cytometry analysis of cyclin B1 positive cells shows increased positive cells in R9 as compared to R0 (F). (G) In the presence of BX795 there is a further increase in cyclin B1 positive cells. (H) Quantification of two experiments shows an increase in cyclin B1 positive cells upon TBK1 inhibition. Error bars represent mean ± S.D.

