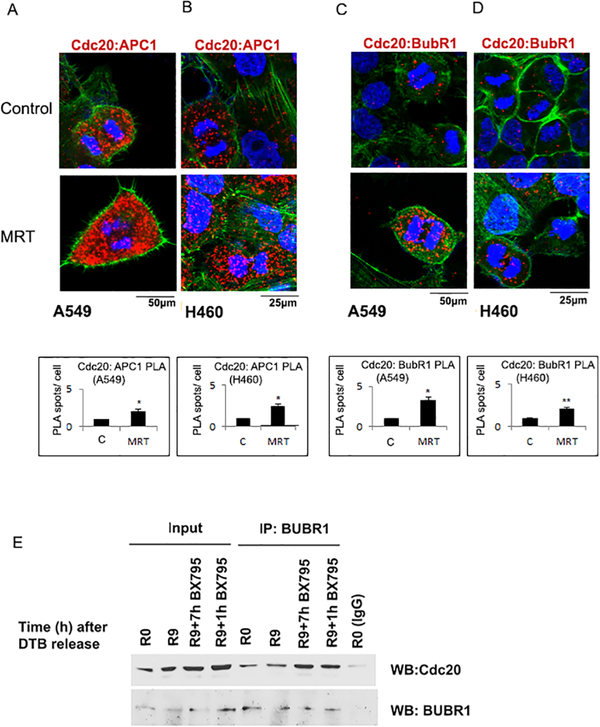
Figure 4: APC1 and BubR1 interaction with Cdc20 increases on TBK1 inhibition.
Cells were synchronized at G1/S and released for 9 hours (R9) and treated with TBK1 inhibitor MRT67307 or not for 7 hours, starting 2 hours after release. (A-B) Confocal images of PLA shows an increased association of Cdc20 and APC1 in A. A549 and B. H460 cells after TBK1 inhibition. (C-D) PLA shows an increased association of Cdc20 and BubR1 in C. A549 and D. H460 cells after TBK1 inhibition. Red dots represent foci of interaction of Cdc20 with APC1 or BubR1. DAPI is shown in blue and phalloidin in green. Plots represent quantification of interaction from two independent experiments. A minimum of 100 cells were considered for each quantification. A two-tailed T-test was done for significance. p≤ 0.05 was considered significant. (*=p<0.05 and **=p<0.01) Error bars represent mean ± S.D. (E) Immunoprecipitation- western blot analysis performed on A549 cells, G1/ S synchronized, which were released for 9 hours from the block and treated for the indicated time periods with TBK1 inhibitor show that interaction of Cdc20 with BubR1 increases on TBK1 inhibition. Cell lysates were immunoprecipitated with BubR1 antibody, western blotting was done for Cdc20 to confirm the interaction.

