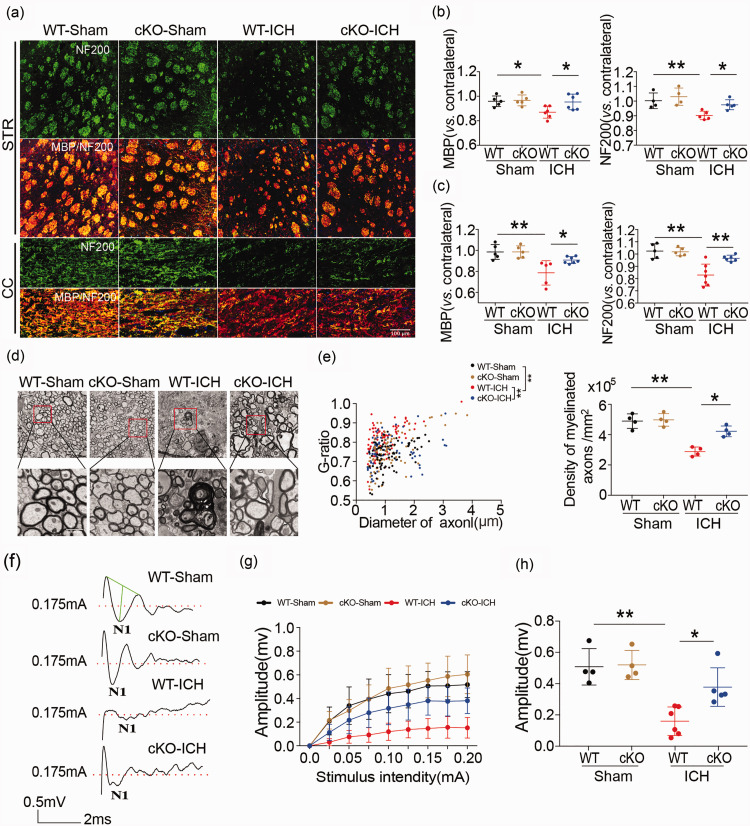
Figure 2.
White matter injury in Cx3cr1CreER:Hdac2fl/fl and WT mice after ICH. (a–c) Double immunofluorescence staining for NF200 and MBP in the ipsilateral striatum and corpus callosum 35 days after ICH (Scale bar = 100 µm) and the fold decrease in MBP and NF200 in the striatum and corpus callosum demonstrated the degree of WMI 35 days after ICH. (d) Representative images of myelin sheath damage in sham groups (WT and HDAC2 çKO mice) and ICH groups (WT and HDAC2 çKO mice) 35 days after ICH (Scale bar = 4µm or 1000nm). (e) Quantification of the g-ratio (the ratio of axonal diameter to overall diameter of the axon plus myelin) and axon density in sham groups (WT and HDAC2 çKO mice) and ICH groups (WT and HDAC2 çKO mice) 35 days after ICH. (f) Representative traces of the evoked CAPs in the CC (stimulus, 0.175 mA; 0.48 mm lateral to the stimulating electrode) 35 days after ICH. (g) Signal conduction along nerve fibers, as measured by the amplitude of the N1 component of the CAPs in response to increasing stimulus strength (0.0–0.20 mA) (h) N1 amplitude in response to a 0.175 mA stimulus 35 days after ICH. Illustration of the regions for immunohistochemistry, RT-PCR, electron microscropy and CAP measurement is shown in Supplementary Figure 4. n = 5–7/group. * p ≤ 0.05, ** p ≤ 0.01. All data are presented as mean ± SD.

