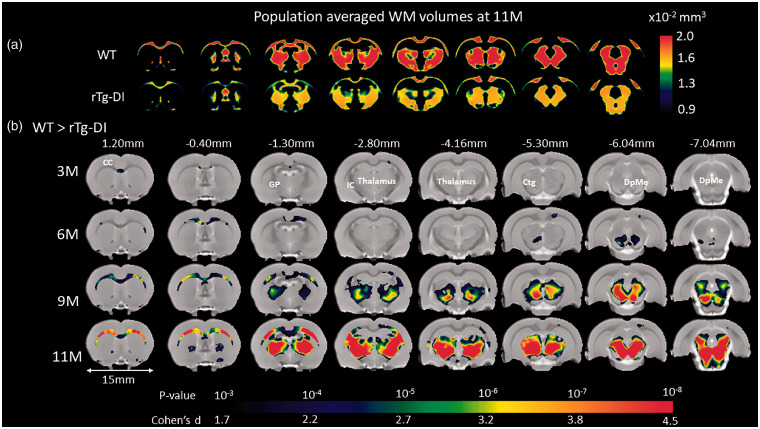
Figure 2.
Age-dependent WM loss occurs in a specific anatomical pattern in rTg-DI rats. (a) Spatially normalized population-averaged WM volumetric maps of 11 month (M) old rTg-DI and WT rats are shown in color maps, highlighting extensive WM loss in 11 M rTg-DI rats compared to WT. (b) For each age group, statistical parametric maps (color coded for p-values) were calculated at p-value < 0.05 after FDR multiple comparison correction and overlaid onto population-averaged proton density-weighted MRI images to display anatomical areas with significant white matter (WM) loss in rTg-DI in comparison to WT rats. Cohen’s d represents the effect size. Anatomical levels of the axially displayed anatomical templates are given by their nearest Bregma distance. At 3 M and 6 M, only the corpus callosum (CC) and deep mesencephalic nuclei (DpMe) were significant for WM loss in the rTg-DI rats. However, at 9 M and 11 M, significant WM loss in rTg-DI rats was widespread and included the CC, globus pallidus (GP), internal capsule (IC), thalamus and central tegmental tract (ctg). Scale bar = 15 mm.

