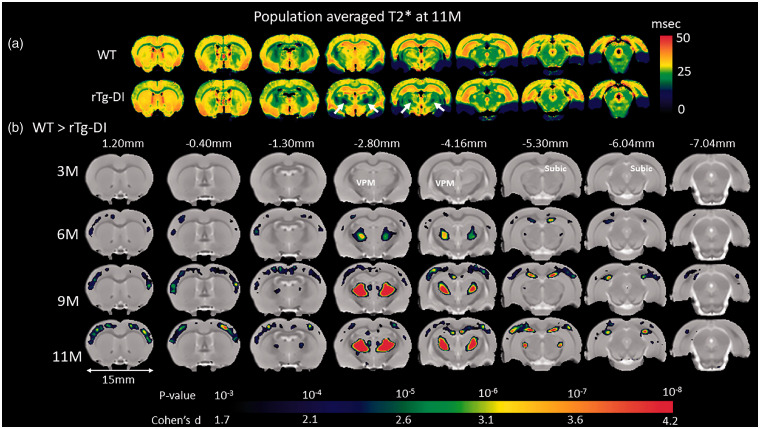
Figure 5.
Brain areas with reduced T2* values in rTg-DI compared to WT rats. (a) Spatially normalized population averaged color-coded T2* maps of 11 M old rTg-DI and WT rats. Blue and red colors represent low and high T2* values, respectively. Significantly reduced T2* values (white arrows) in the thalamus are suggestive of blood products. (b) Voxel-wise T2* analyses were performed to quantify areas with statistically significant T2* differences between WT and rTg-DI rats at 3 M, 6 M, 9 M and 11 M of age. The statistical parametric maps of significantly reduced T2* values in rTg-DI rats compared to WT rats (with color-coded p-values) are overlaid onto a population-averaged anatomical PDW template and show changes in thalamus (ventral posteromedial nucleus (VPM)), subiculum (subic), and in the somatosensory cortices. Cohen’s d represents the effect size. Scale bar = 15 mm.

