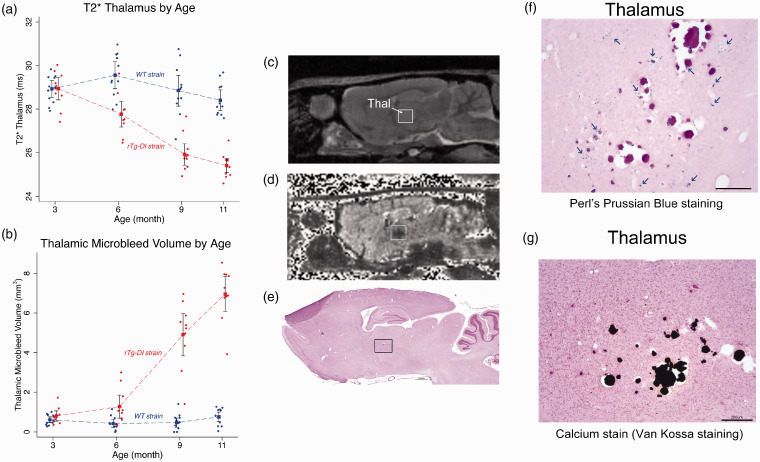
Figure 6.
Thalamic microbleeds by T2* emerge at 6 M in rTg-DI rats. (a) Age-dependent trajectories of the total thalamic CMB load in rTg-DI rats from 3 M to 11 M as evaluated by mean T2* values. Blue and red filled circles represent WT and rTg-DI rats, respectively. Statistical analyses show that age-dependent trajectories of the two strains are statistically different with respect to the age groups (p-value < 0.0001). A distinct difference between mean T2* data is present at 6 M in rTg-DI rats: mean T2* is 1.8 ms lower than WT rats, (p-value = 0.001). (b) Age-dependent CMB volume derived based on number of voxels with T2* values ≤20 ms within the thalamus in comparison to WT rats. Blue and red filled circles represent WT and rTg-DI rats, respectively. Rapid CMB growth is apparent at 9 M and onwards in rTg-DI rats (p-values for pairwise mean differences at both 9 M and 12 M < 0.001). Model estimates are presented as means (filled squares) with 95% pairwise confidence intervals (black bands) using generalized estimating equations (GEE). (c) Anatomical proton-density-weighted MRI from an rTg-DI rat in the sagittal plane at the level of the dorsal hippocampus and thalamus. Thal: thalamus. (d) Corresponding T2* map from the same rat shown in (c). The hypointense areas in the Thal are evident. (e)Post-mortem histological stain for perivascular hemosiderin using Perl’s Prussian Blue stain. The black box depicts the magnified areas (f, g). (f) Magnified area from the thalamus showing numerous small deposits hemosiderin deposits (indicated by blue arrows), many surrounding what appear to be occluded vessels. (g) Numerous occluded and calcified microvessels were confirmed in the same thalamic area. Scale bars = 50 µm.

