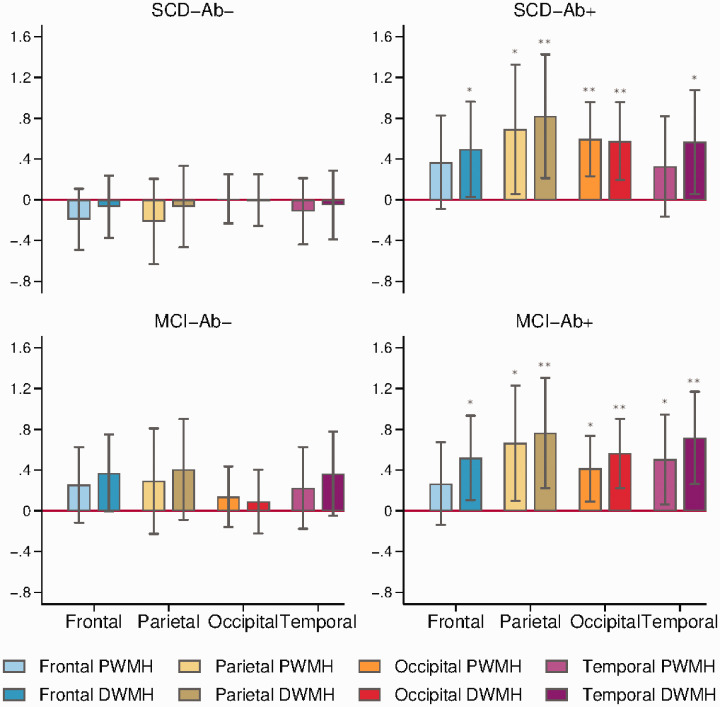
Figure 3.
Regional WMH loads. Barplots of regression coefficients with regional WMH loads as dependent variables and group dummy variables as independent variables, showing the differences in SCD-Aβ+, MCI-Aβ− and MCI-Aβ+ compared with NC-Aβ−, adjusted for age and scanners, with error bars marking 95% confidence intervals. * p<0.05. ** p<0.01

