Figure 2.
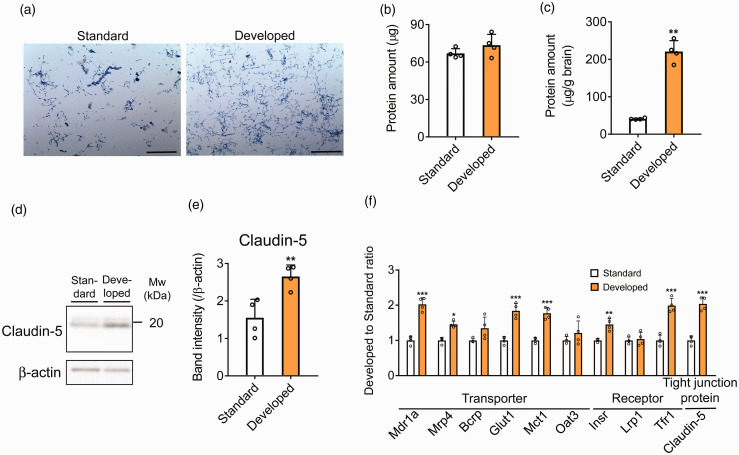
Brain capillary isolation and evaluation of brain capillary enrichment by standard method and developed method. (a) Images of isolated brain capillary by standard method and developed method. Brain capillaries were stained by trypan blue. Scale bar = 250 µm. (b, c) Protein amount of isolated brain capillary fraction by standard method from pooled five mouse brains and those by developed method from a single mouse brain. Total protein amount (b) and protein amount per brain weight (c) were indicated. (d, e) Western blot analysis of protein amount in the brain capillary fraction isolated by standard method and developed method; 1 µg protein of brain capillary fraction was loaded to each lane. Representative Western blot images are shown. Quantification of each band intensity was performed by using ImageJ software. The protein expression was normalized by β-actin as a loading control. (f) Protein amount ratio (developed to standard) of transporters, receptors, and tight junction proteins quantified by MRM; 1 µg protein of brain capillary fraction was injected into the LC-MS/MS. Each data represent the mean ± SD (n = 4). *p < 0.05, **p < 0.01 and ***p < 0.001, significantly different from standard.

