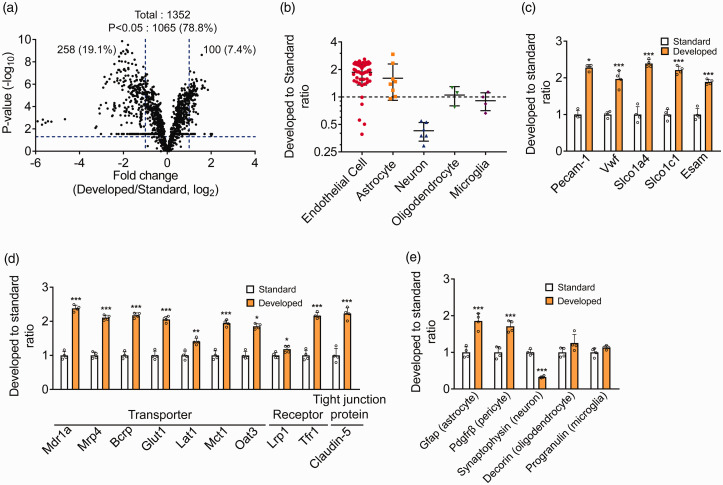
Figure 3.
Differences in the protein profile of isolated brain capillary fraction between standard method and developed method. (a) Volcano plot of identified proteins by proteomic analysis of brain capillary fraction isolated by standard method and developed method. The p-values in the t-test were plotted against the fold-change (Developed/Standard) of protein expression for all identified proteins. The horizontal line in the plot represents the criterion of significance (p = 0.05). The vertical lines indicate fold changes (0.5, 2.0). (b) Dot plot of protein amount ratio (Developed to Standard) of marker protein quantified by proteomic analysis. The term “Oligodendrocyte” comprises the oligodendrocyte precursor cell, newly formed oligodendrocyte, and myelinating oligodendrocyte. (c) Protein amount ratio (developed to standard) of brain capillary endothelial cell marker protein (Pecam-1) and four brain capillary endothelial cell-specific proteins. (d, e) Protein amount ratio (developed to standard) of transporters, receptors, and tight junction proteins related to BBB transport function (d) and other cell types marker proteins (e) by proteomic analysis. Each data represent the mean ± SD (n = 4). *p < 0.05, **p < 0.01 and ***p < 0.001, significantly different from standard.

