Figure 5.
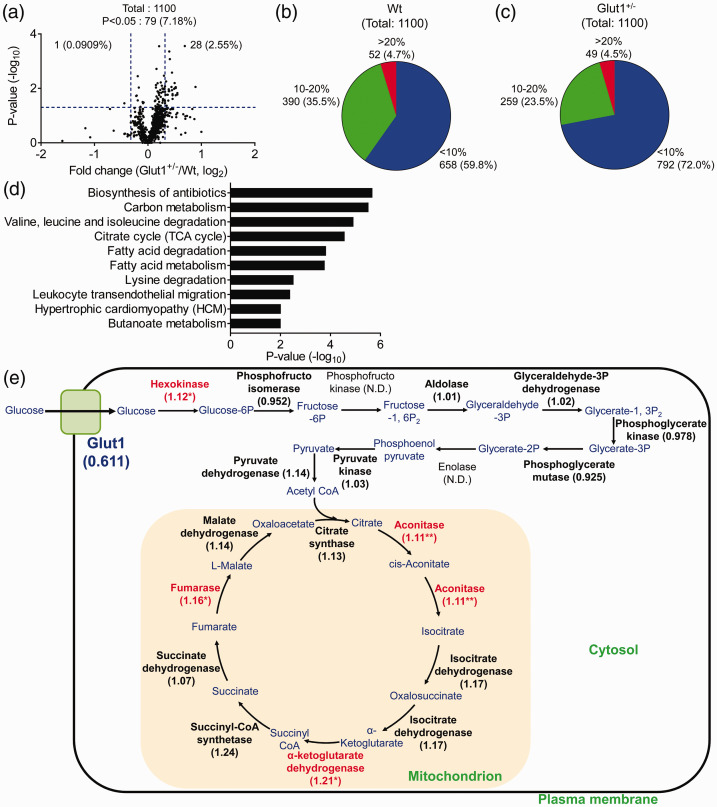
Changes of protein expression in isolated brain capillary fraction from Glut1+/− mouse. (a) Volcano plot of identified proteins. The p-values were plotted against the fold change (Glut1+/−/Wt) of protein expression for all identified proteins. The horizontal line in the plot represents the criterion of significance (p = 0.05). The vertical lines indicate fold changes (0.8, 1.25). (b, c) Distribution of CV(%) of each protein peak area in Wt (b) and Glut1+/− (c) mice quantified by proteomic analysis. (d) Functional annotation clustering and enrichment analysis of proteins for which expression was significantly increased in Glut1+/− mouse by DAVID. The terms giving the 10 lowest p-values in the KEGG pathway. (e) Changes of glycolysis and TCA cycle enzyme in Glut1+/− mouse. Each value indicates the fold change of protein expression and red bold letters indicate the significantly increased enzyme in Glut1+/− mouse. *p < 0.05 and **p < 0.01, significantly different from Wt mice. N.D.; not detected.

