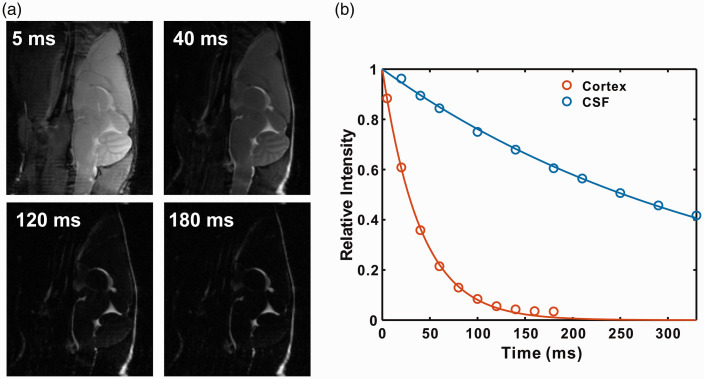
Figure 2.
The T2 values of cortex and CSF were measured using a CPMG preparation module followed by a RARE imaging module. (a) Representative sagittal images of mouse brain recorded with different echo times. (b) The signal decay as a function of echo time for tissue and CSF, respectively.
CSF: cerebrospinal fluid.

