Figure 3.
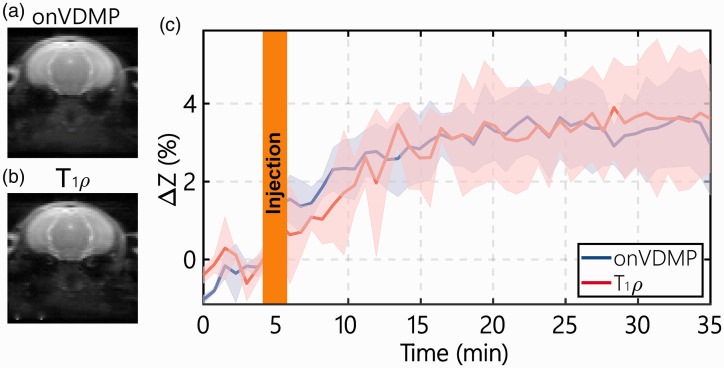
Comparison of the DGE curves during D-glucose infusion obtained with onVDMP and T1ρ sequences: typical onVDMP (a) and T1ρ (b) images are plotted to show the location of the slice and the image quality. (c) DGE curves of mouse parenchyma acquired by onVDMP MRI (blue) with 12 binomial pulse pairs (36 ms) and T1ρ imaging (red) with a saturation time of 36 ms on WT mice (n = 3; standard deviation indicated in light blue and red). The unit of ΔZ is %.
onVDMP: on-resonance variable delay multiple pulse.

