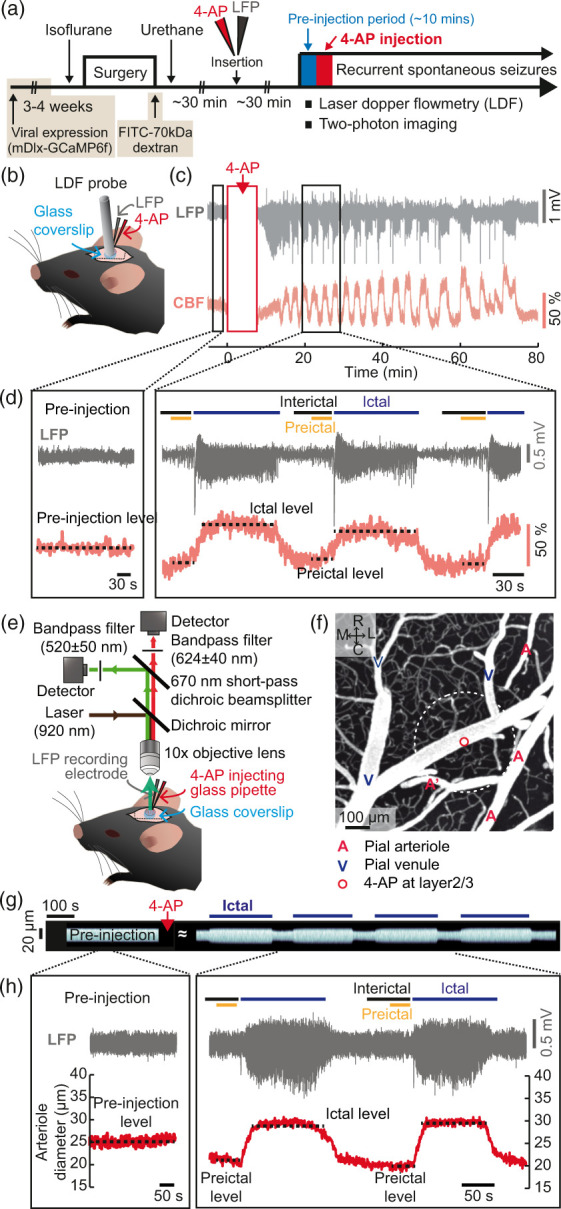
Figure 1.

Dynamics of CBF and vascular diameter during recurrent spontaneous seizures. (a) Schematic representation of the experimental procedures. Four different sets of experiments were separately conducted in different animal groups: one for LDF recording (wild-type C57BL/6 mice) and the others for two-photon microscopic imaging of cortical pial vessels (wild-type C57BL/6 mice), excitatory (C57BL/6J-Tg-Thy1GCaMP6f5.17) and inhibitory calcium activity assessment (wild-type C57BL/6 mice injected with AAV9-mDlx-GCaMP6f virus, 3–4 weeks prior to the experiment). (b) Schematic of the placement of the LDF recording probe with a glass pipette and an LFP recording probe. (c) Examples of LFP and CBF traces over time showing that seizures repeatedly occurred at intervals of several tens of seconds or several minutes for about an hour. (d) Magnified views of LFP and CBF traces during the pre-injection period and during recurrent seizures (square boxes in (c)). (e) Diagram of the two-photon imaging system. (f) Two-photon z-stack projection image up to ∼100 μm from the pial surface. A: arteriole, V: venule. R: rostral, C: caudal, M: medial and L: lateral. The tip of the glass pipette was located ∼350 μm below the pial surface, which is marked with a white dotted line. (g) Stacks of perpendicular lines over time on one branch point of the pial arteriole indicated as A′ in (f). (h) Example of LFP signals and pial arteriole diameter changes during the pre-injection period and during recurrent seizures.
