
Figure 2.
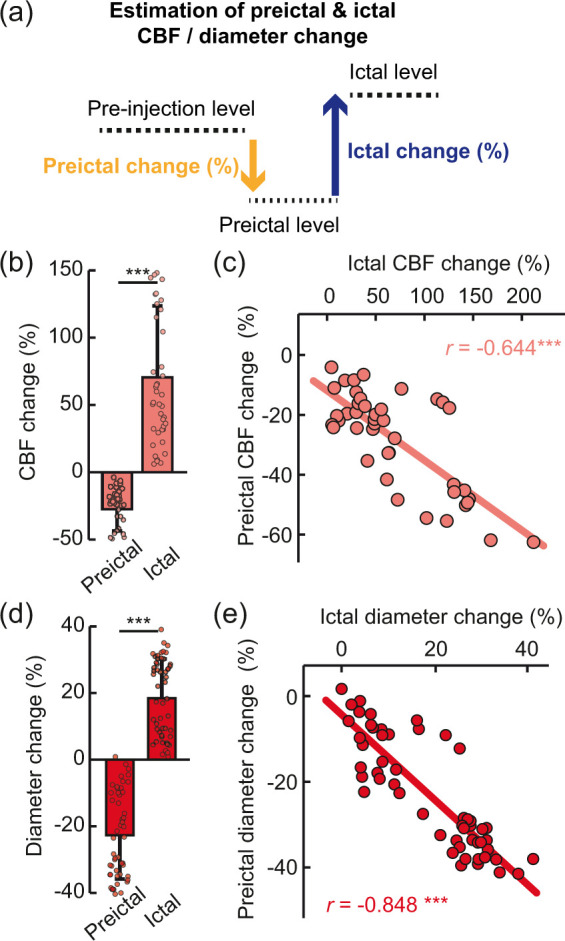
Preictal and ictal changes in CBF and arteriole diameter. (a) Schematic of changes in CBF and vessel diameter during the pre-injection, preictal and ictal periods. To estimate preictal changes (%), each preictal level was normalized by the average pre-injection level. To estimate ictal change, the ictal level was averaged during the full ictal period, and this value was then normalized with the preceding preictal level. (b) Preictal (−27.98 ± 16.18%) and ictal (69.00 ± 52.47%) CBF changes (total number of seizures = 42, n = 5, mean ± SD, ***p < 0.001 by Wilcoxon signed-rank test). (c) Relationship of the preictal CBF change with the ictal CBF change (total number of seizures = 42, n = 5, Spearman’s r=−0.644, ***p < 0.001, R2=0.572). (d) Preictal (−22.71 ± 13.01%) and ictal (18.47 ± 11.65%) arteriole diameter changes (total number of seizures = 53, n = 8, mean±SD, ***p < 0.001 by Wilcoxon signed-rank test). (e) Relationship of the preictal arteriole change with the ictal arteriole change (total number of seizures n = 53, n = 8, Spearman’s r=−0.848, ***p < 0.001, R2=0.746).