Figure 5.
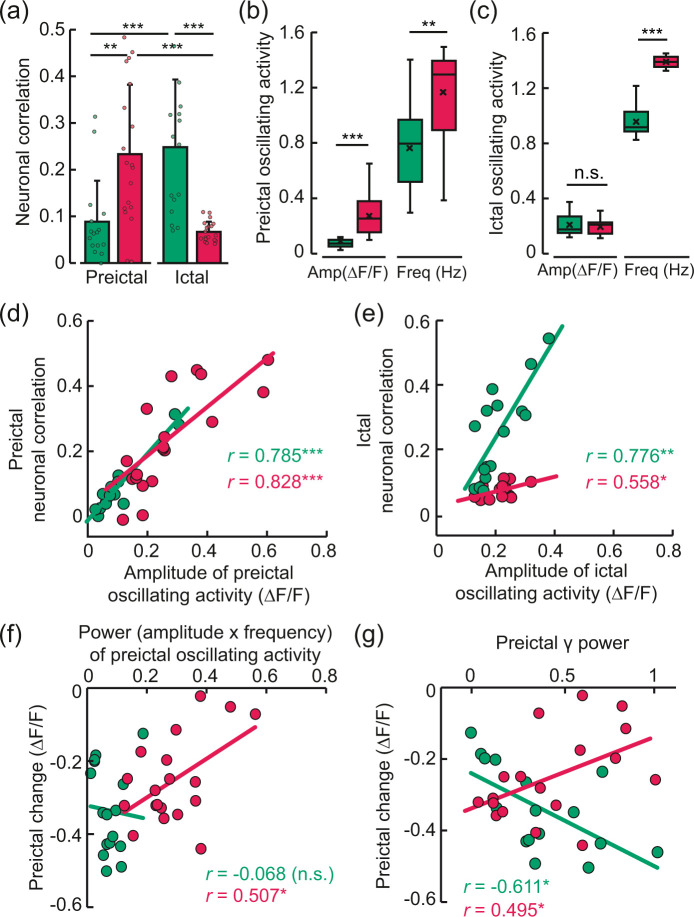
Preictal and ictal neuronal synchrony and their relationships with oscillating activity. (a) Correlation coefficients between all pairs of registered neuron ROIs (cell soma within the range of 200–700 μm) during the preictal and ictal periods. Preictal, excitatory: 0.09 ± 0.09; preictal, inhibitory: 0.23 ± 0.15; ictal, excitatory: 0.25 ± 0.14; ictal, inhibitory: 0.07 ± 0.02 (mean ± SD; preictal excitatory & inhibitory, **p = 0.001 by Mann-Whitney U test; ictal excitatory & inhibitory, ***p < 0.001 by independent t-test; excitatory preictal & ictal, ***p < 0.001 by Wilcoxon signed-rank test; inhibitory preictal & ictal, ***p < 0.001 by paired t-test). Excitatory: total number of seizures = 16, n = 5, total number of cells = 2345, average number of cells in each seizure trial = 146.56 ± 23.75. Inhibitory: total number of seizures = 19, n = 4, total number of cells = 1070, average number of cells in each seizure trial = 48.64 ± 18.94. (b, c) Box-whisker diagrams of the amplitudes (ΔF/F) and frequencies (Hz) of preictal and ictal oscillating activity in excitatory and inhibitory neurons. The boxes represent the 25th–75th percentiles, and the horizontal lines inside the boxes display the median amplitudes (assessed by Mann-Whitney U test) and frequencies (**p < 0.001, ***p < 0.001, by Mann-Whitney U test; n.s. indicates no statistical significance). (d, e) Relationships between the correlation coefficients (neuronal correlation) and the amplitudes of the oscillating activity during the preictal (excitatory: Spearman’s r = 0.785, ***p < 0.001, R2=0.915; inhibitory: Spearman’s r = 0.828, ***p < 0.001, R2=0.603) and ictal (excitatory: Spearman’s r = 0.776, **p = 0.001, R2=0.626; inhibitory: Pearson’s r = 0.558, *p = 0.013, R2=0.311) states. (f) Relationship of the preictal basal level (shown in Figure 3(k) and (l)) with the power (amplitude x frequency) of the preictal oscillating activity (excitatory: Pearson’s r= −0.068, n.s., R2=0.005; inhibitory: Pearson’s r= 0.507, *p = 0.027, R2=0.258). (g) Relationship between the preictal basal level and the normalized preictal LFP γ power, in excitatory (Pearson’s r=−0.611, *p = 0.01, R2=0.374) and inhibitory neurons (Pearson’s r = 0.495, *p = 0.03, R2=0.245).

