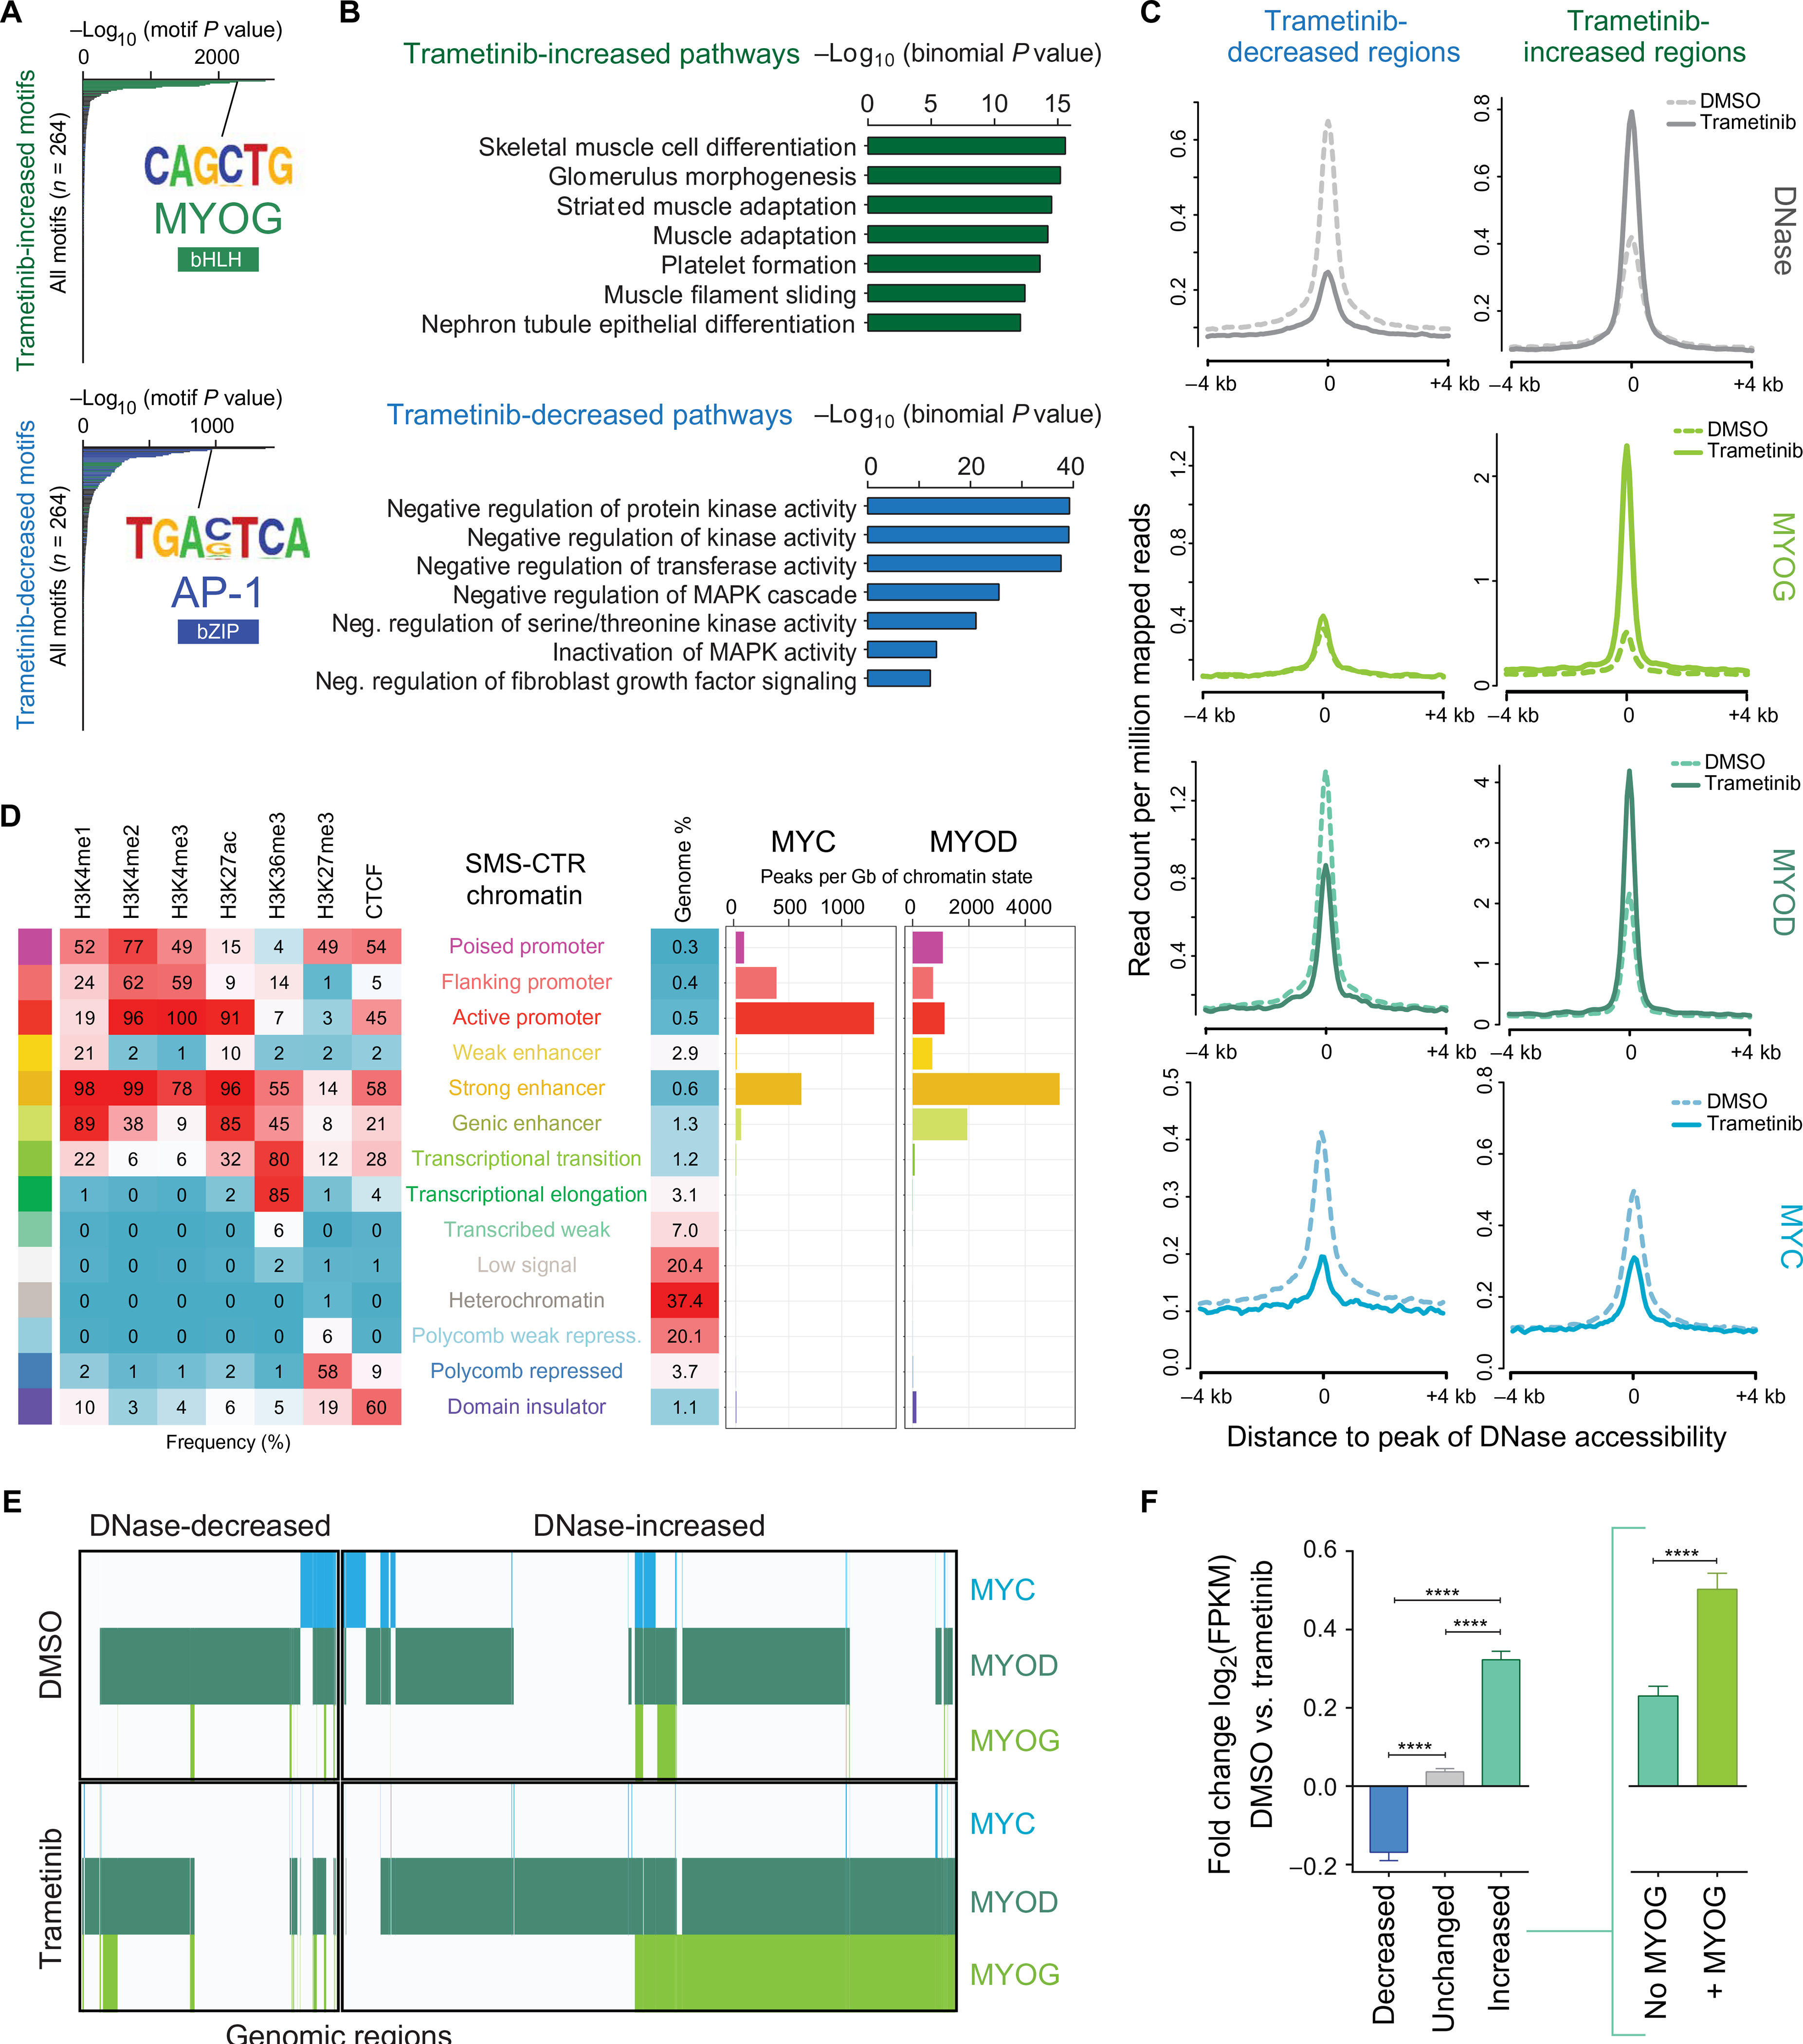
Fig. 4. Trametinib treatment induces chromatin reorganization in SMS-CTR.

(A) Hypergeometric Optimization of Motif Enrichment analysis reveals that regions with increased chromatin accessibility as a function of trametinib treatment are enriched with binding motifs for bHLH transcription factors (green) such as MYOG, among others (top), whereas trametinib-decreased regions are enriched with binding motifs for bZIP transcription factors (blue) such as AP-1, among others (bottom). (B) GREAT analysis shows that increased accessibility regions are enriched for pathways important for skeletal muscle development (green), among others (top), whereas decreased accessibility regions are enriched for pathways important for the negative regulation of MAPK activity (blue), among others (bottom). (C) Composite plots showing DNase hypersensitivity (silver), MYOG (light green), MYOD (dark green), and MYC (blue) signal intensities (RPM) genome-wide in the presence and absence of trametinib treatment in SMS-CTR. (D) MYC and MYOD binding sites overlap enrichments of 12 chromatin states in SMS-CTR, defined by six histone modification marks and CTCF (CCCTC-binding factor). (E) Collaborative co-occupancy of MYC (blue), MYOD (dark green), and MYOG (light green) in the decreased and increased accessibility regions. The presence of each transcription factor at a given region is indicated by a colored line. (F) Bar charts representing the trametinib-induced fold change [log2(FPKM)] of the expression of genes nearest decreased (blue), unchanged (gray), and increased (aqua) accessibility regions. Increased accessibility regions are further subdivided into regions lacking MYOG deposition (aqua, inset at right) and regions with at least one overlapping MYOG peak (green). Error bars represent the 95% confidence interval. ****P < 0.0001, evaluated by Welch’s t test.
