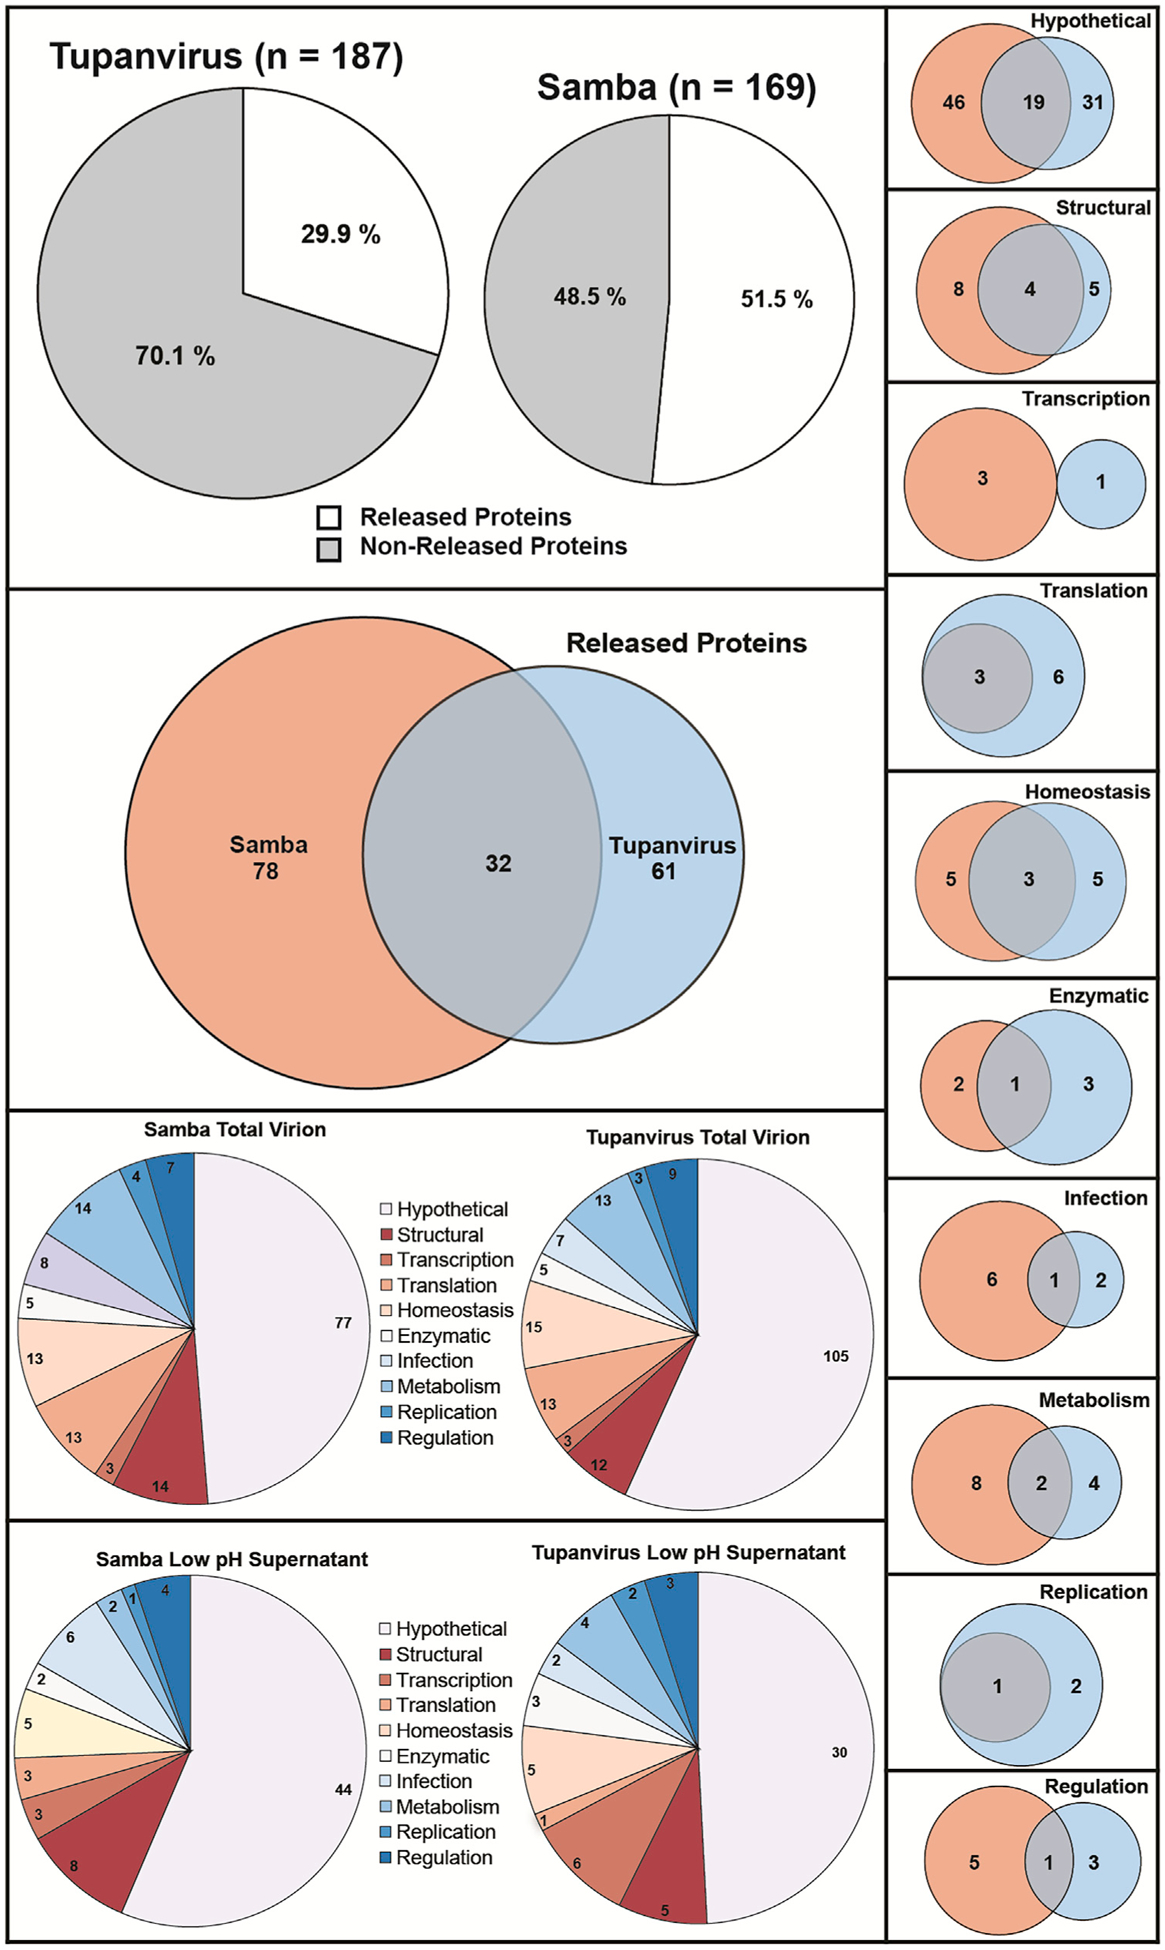
Figure 5. Comparison of Proteins Released by SMBV and TV Soda Lake.

Venn diagrams comparing the total protein content and proteins released following low pH treatment of SMBV and TV particles. The homology present within these protein sets is depicted. See Table S2 for hypothetical proteins with predicted transmembrane domains and Table S3 for the relative abundance of individual proteins. See also Figure S2.
