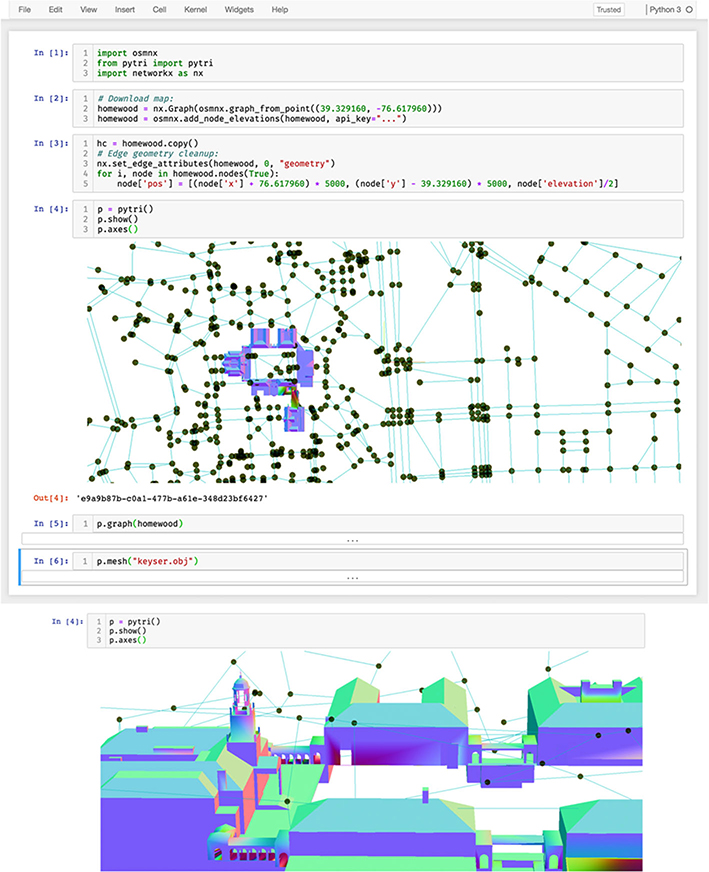
Fig. 7.
Using open street and path data from osmnx [24] and building meshes from 3D Warehouse [27, 28], pytri displays a graph representation of the roads and paths surrounding the Johns Hopkins University Homewood campus. Top: The researcher renders an interactive 3D visualization of the region using pytri from within a code cell of a Jupyter notebook. Bottom: Clicking and dragging the visualization cell inside the notebook enables the user to navigate the visualization in 3D space. In this screenshot, the user renders a close-up angle of the Gilman Clock Tower mesh. Despite rendering large meshes and graphs side by side in 3D, this tool enables interactive, realtime, detailed visualization

