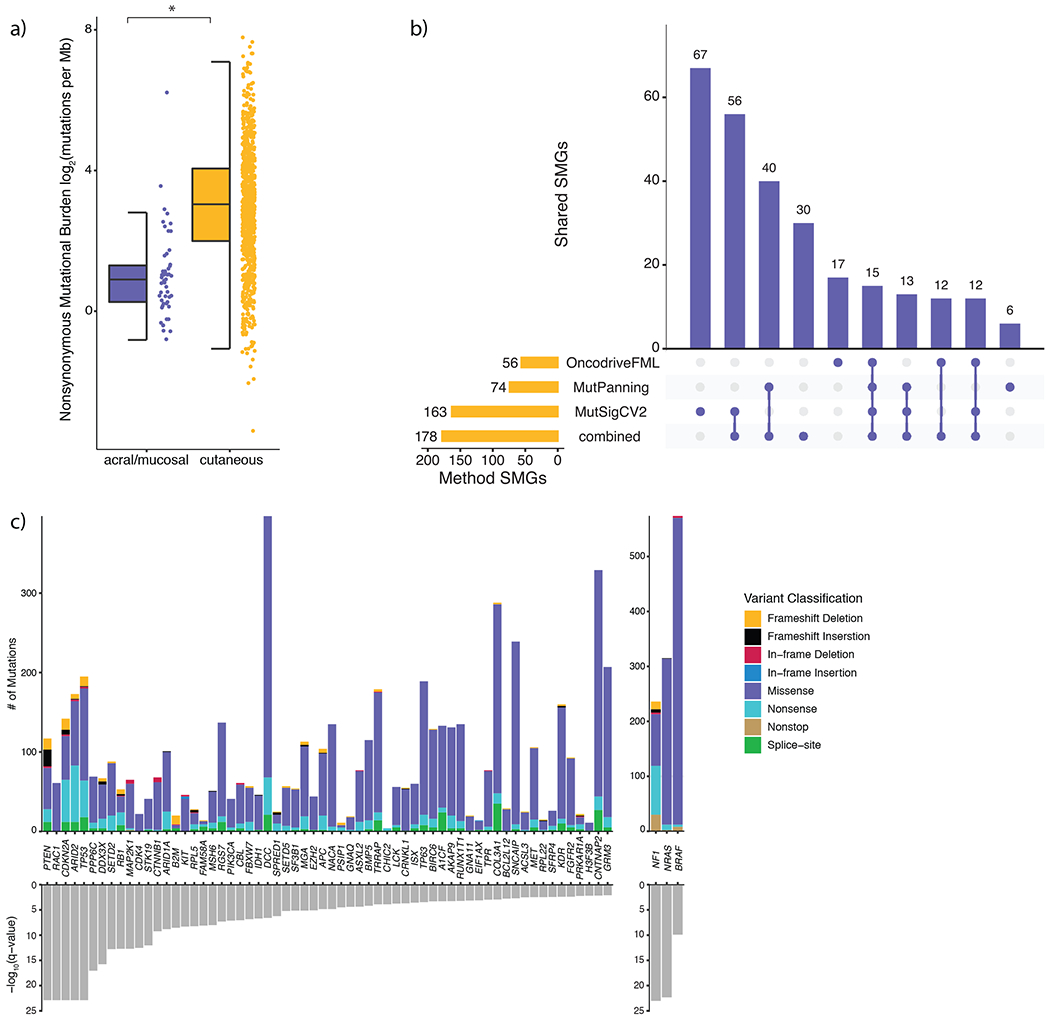
Figure 1: Identification of consensus driver genes in melanoma.

a) Nonsynonymous mutational load is significantly elevated in cutaneous (n = 871) melanomas compared to acral (n = 34) and mucosal (n = 17) melanomas (Mann-Whitney U, p = 9.79 x 10⁻¹⁶, two-sided). The data are represented as a boxplot where the middle line is the median, the lower and upper edges of the box are the first and third quartiles, the whiskers represent the interquartile range (IQR) multiplied by 1.5, and beyond the whiskers are outlier points. An asterisk denotes a Mann-Whitney U p-value < 0.05. b) The overlap between significantly mutated genes (SMGs) identified by each mutational significance algorithm (Benjamini-Hochberg, q-value cutoff < 0.05), and when combining the p-values via Brown’s method (Benjamini-Hochberg, q-value cutoff < 0.05). c) The distribution of mutation types in melanoma SMGs that are known cancer genes (CGC and OncoKB genes), ordered by statistical significance from left to right.
