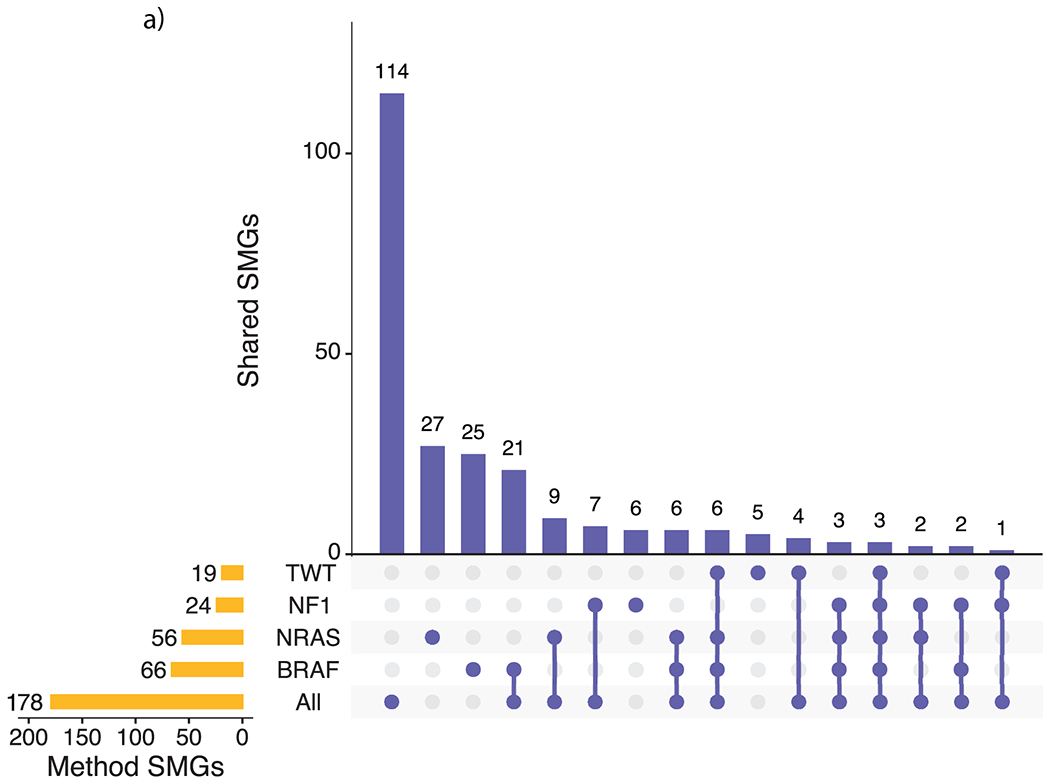
Extended Data Fig. 1. Overlap between SMGs from the entire cohort and subtype analyses.

a, Overlap between the subtype-specific SMGs and the SMGs that were identified via the entire cohort (M1000). Most of the SMGs identified in the entire cohort analysis were not identified through the subtype specific analysis (115 of 178, 64.6%).
