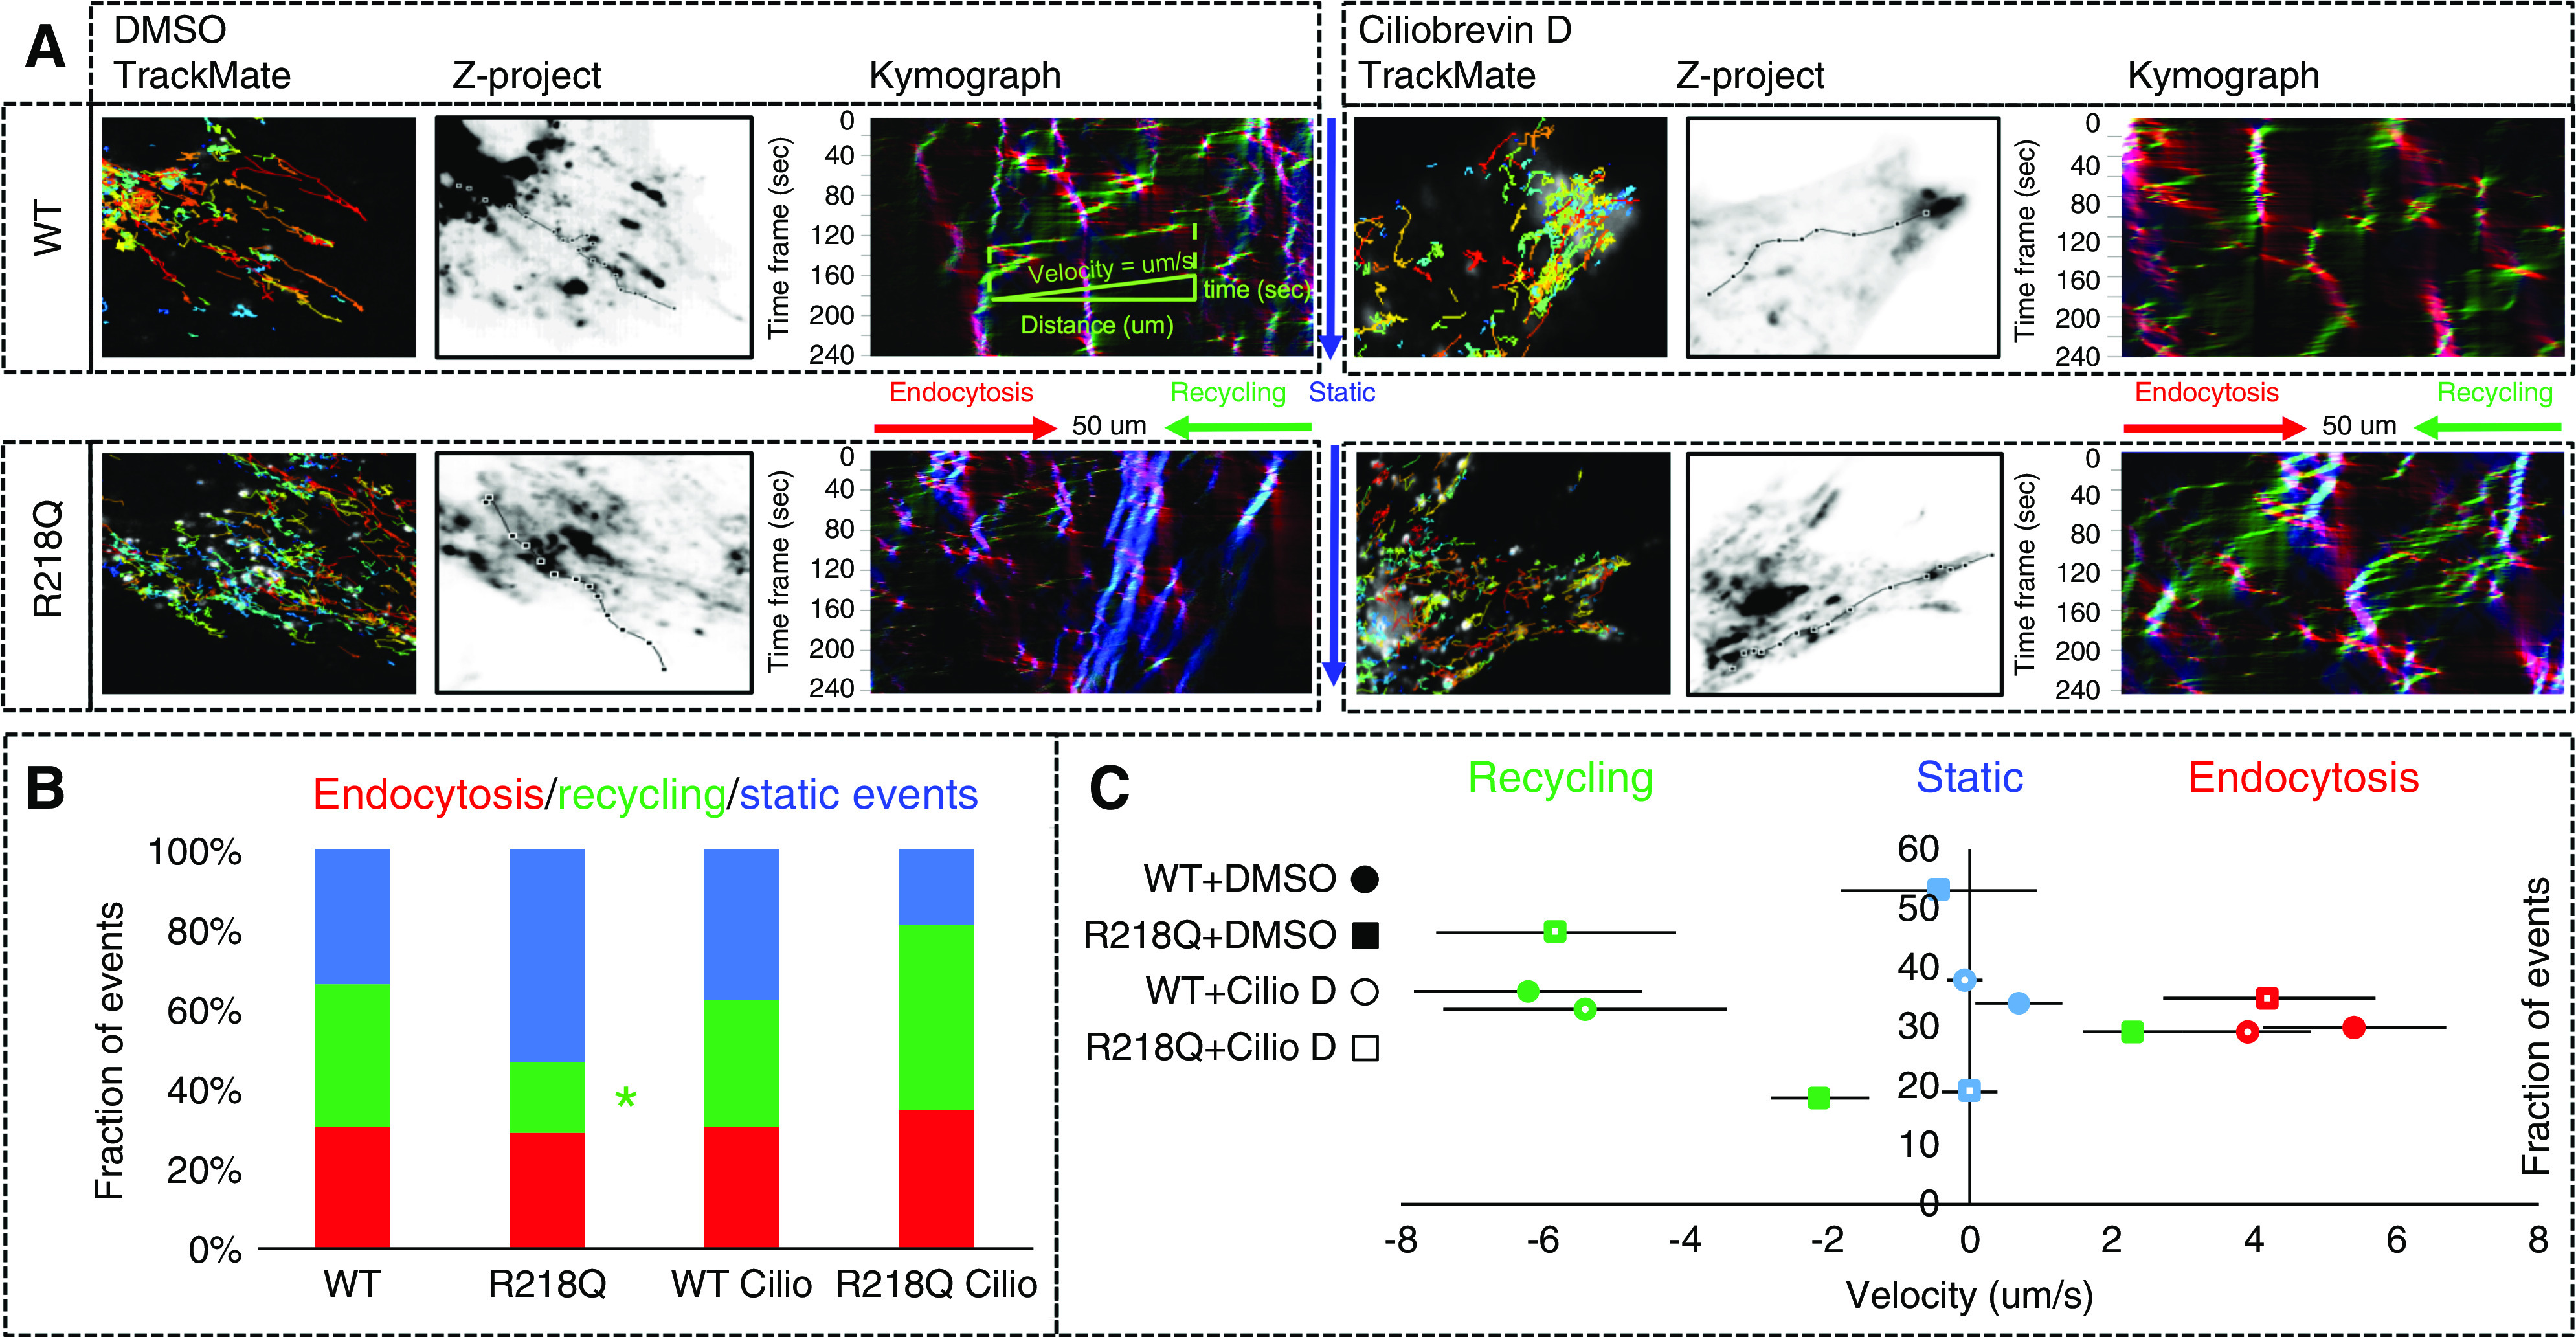
Figure 4.

Time-lapse imaging and single-molecule tracking of nephrin using KymographClear, KymographDirect, and TrackMate. (A) The endocytic, recycling, and static events are labeled in red, green, and blue, respectively. Single-molecule tracking of nephrin was performed five times × five cells × three independent experiments. (B) The fractions and (C) average velocities of trafficking events in cells treated with Ciliobrevin (50 μM) and control cells treated DMSO (0.3%) were analyzed by using one-way ANOVA and the difference between groups analyzed by Student–Newman–Keuls (SNK) q test. *P<0.05 versus WT control (DMSO).
