Figure 7.

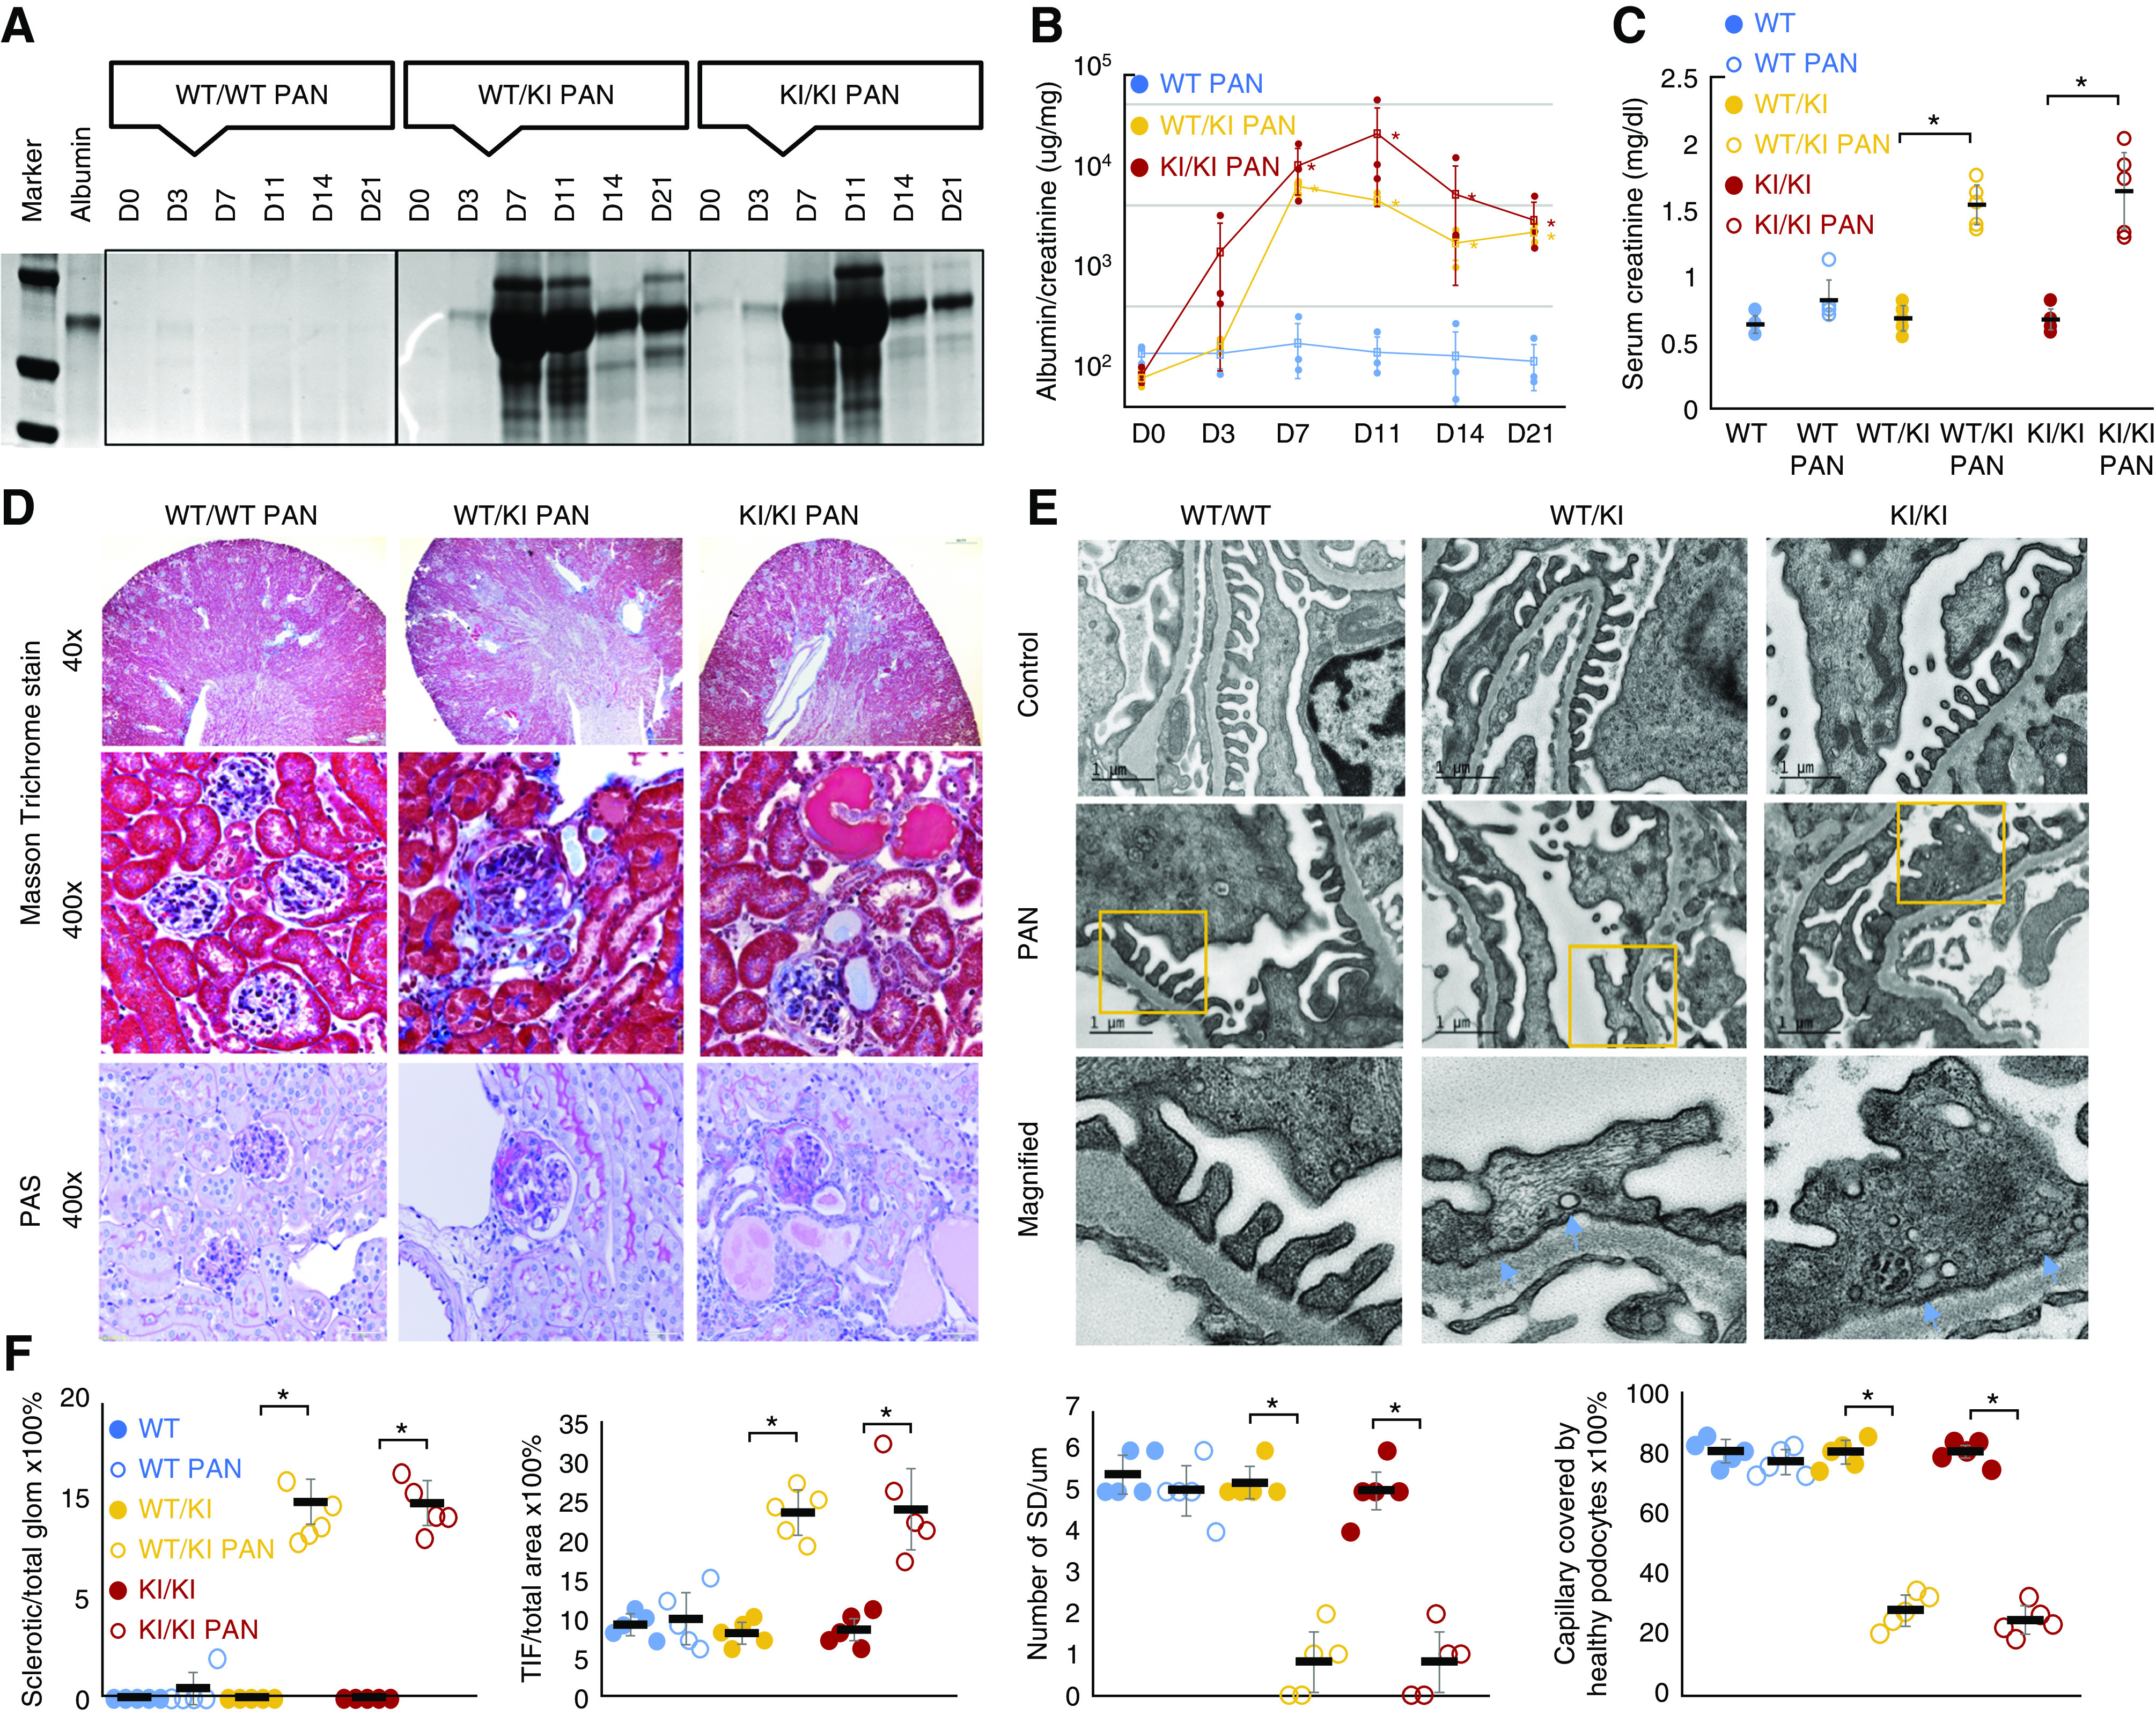
PAN of R218Q KI mice. PA-induced proteinuria in R218Q KI mice (wt/ki and ki/ki, but not in wt/wt mice) as demonstrated by Coomassie blue stain of a urine gel (A). (B) The trend of urine albumin to creatinine ratio in PAN of INF2-transgenic mice. Data were analyzed using repeated-measures ANOVA and the differences among wt/wt, wt/ki, and ki/k mice were analyzed by SNK q test. P<0.05 versus wt/wt mice at the same time point (n=3 for each genotype). (C) Kidney function was assessed by measured serum creatinine levels in blood samples collected at the time of animal sacrifice (D21). Data were analyzed using independent sample t test (n=5). P<0.05, PAN versus control mice of the same genotype without PA injection. (D) Masson trichrome and periodic acid–Schiff stain of mouse kidney sections showed PA induced segmental and global glomerulosclerosis in R218Q KI mice, and increased tubulointerstitial fibrosis. (E) Electron microscopy showed podocytopathy of PAN in R218Q KI mice characterized by foot process effacement with clusters of active vesiculation (orange arrows). (F) The glomerulosclerosis was quantified as the ratio of sclerotic glomeruli/total glomeruli, and tubulointerstitial fibrosis (TIF) was quantified as the ratio of TIF area to the whole section area. The podocytopathy was quantified by measuring the number of SDs per μm and capillary length covered by healthy appearing podocytes with intact foot processes and SDs (G). Data were analyzed using independent sample t test (n=5). P<0.05 PAN versus control mice of the same genotype without PA injection.
