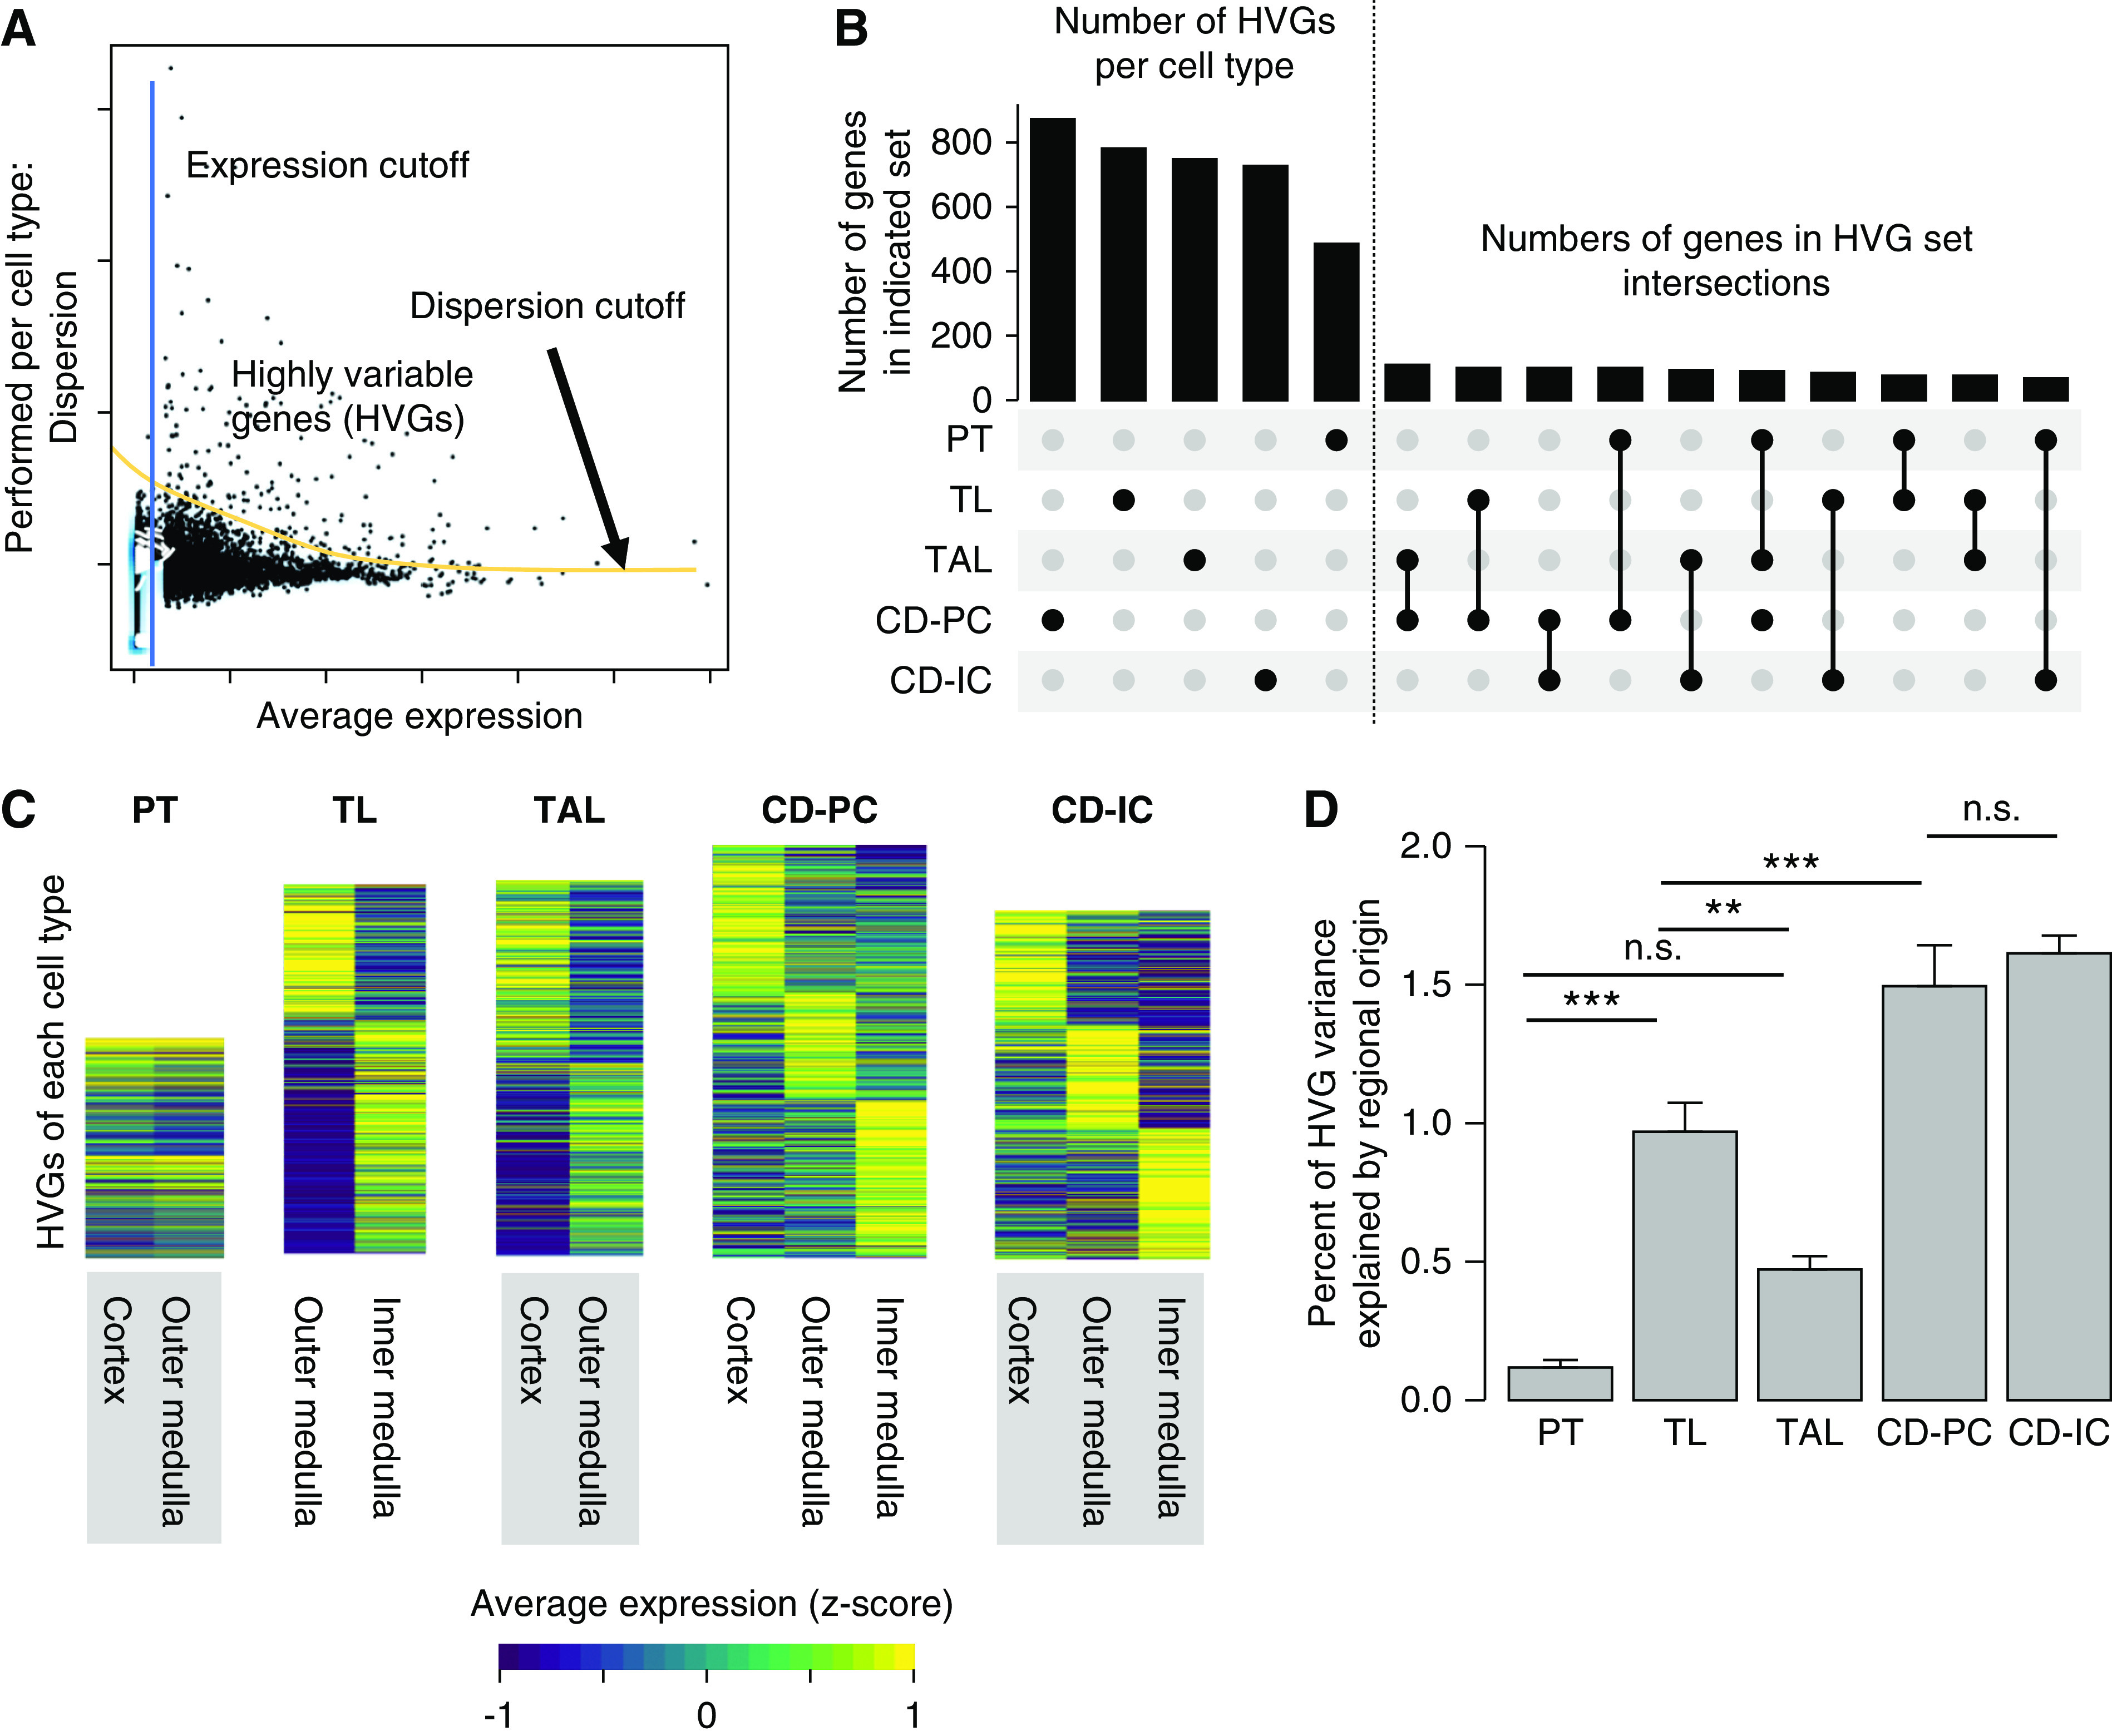
Figure 2.

HVGs within region-spanning tubular cell types harbor spatial information. (A) HVGs are generated per cell type by applying a minimum expression and dispersion cutoff. The picture depicts a scheme for the derivation of HVGs by applying mean expression and dispersion cutoffs. This is done separately for all region-spanning cell types (PT, TL, TAL, CD-PC, CD-IC). Individual dots represent single genes. (B) Most HVGs are cell-type specific. Upset plot for HVGs. There are usually hundreds of HVGs per cell type (left of dotted line, cell type represented by black dot in lower panel), which only show very limited overlap between cell types (right of dotted line, intersections as indicated in the lower panel). (C) HVGs show regional expression profile. Shown are heatmaps of HVGs for the five region-spanning tubule cell types. Gene expression was z-score normalized over all five cell types on a per-gene basis and HVGs were fold-change sorted per cell type. (D) Regional origin contributes differently to HVG variance in region-spanning cell types. Bar plot showing the percentage of HVG variance explained by regional origin (cortex, outer, or inner medulla; mean+SEM, one-way ANOVA; P value: *<0.05, **<0.01, ***<0.001).
