Figure 3.

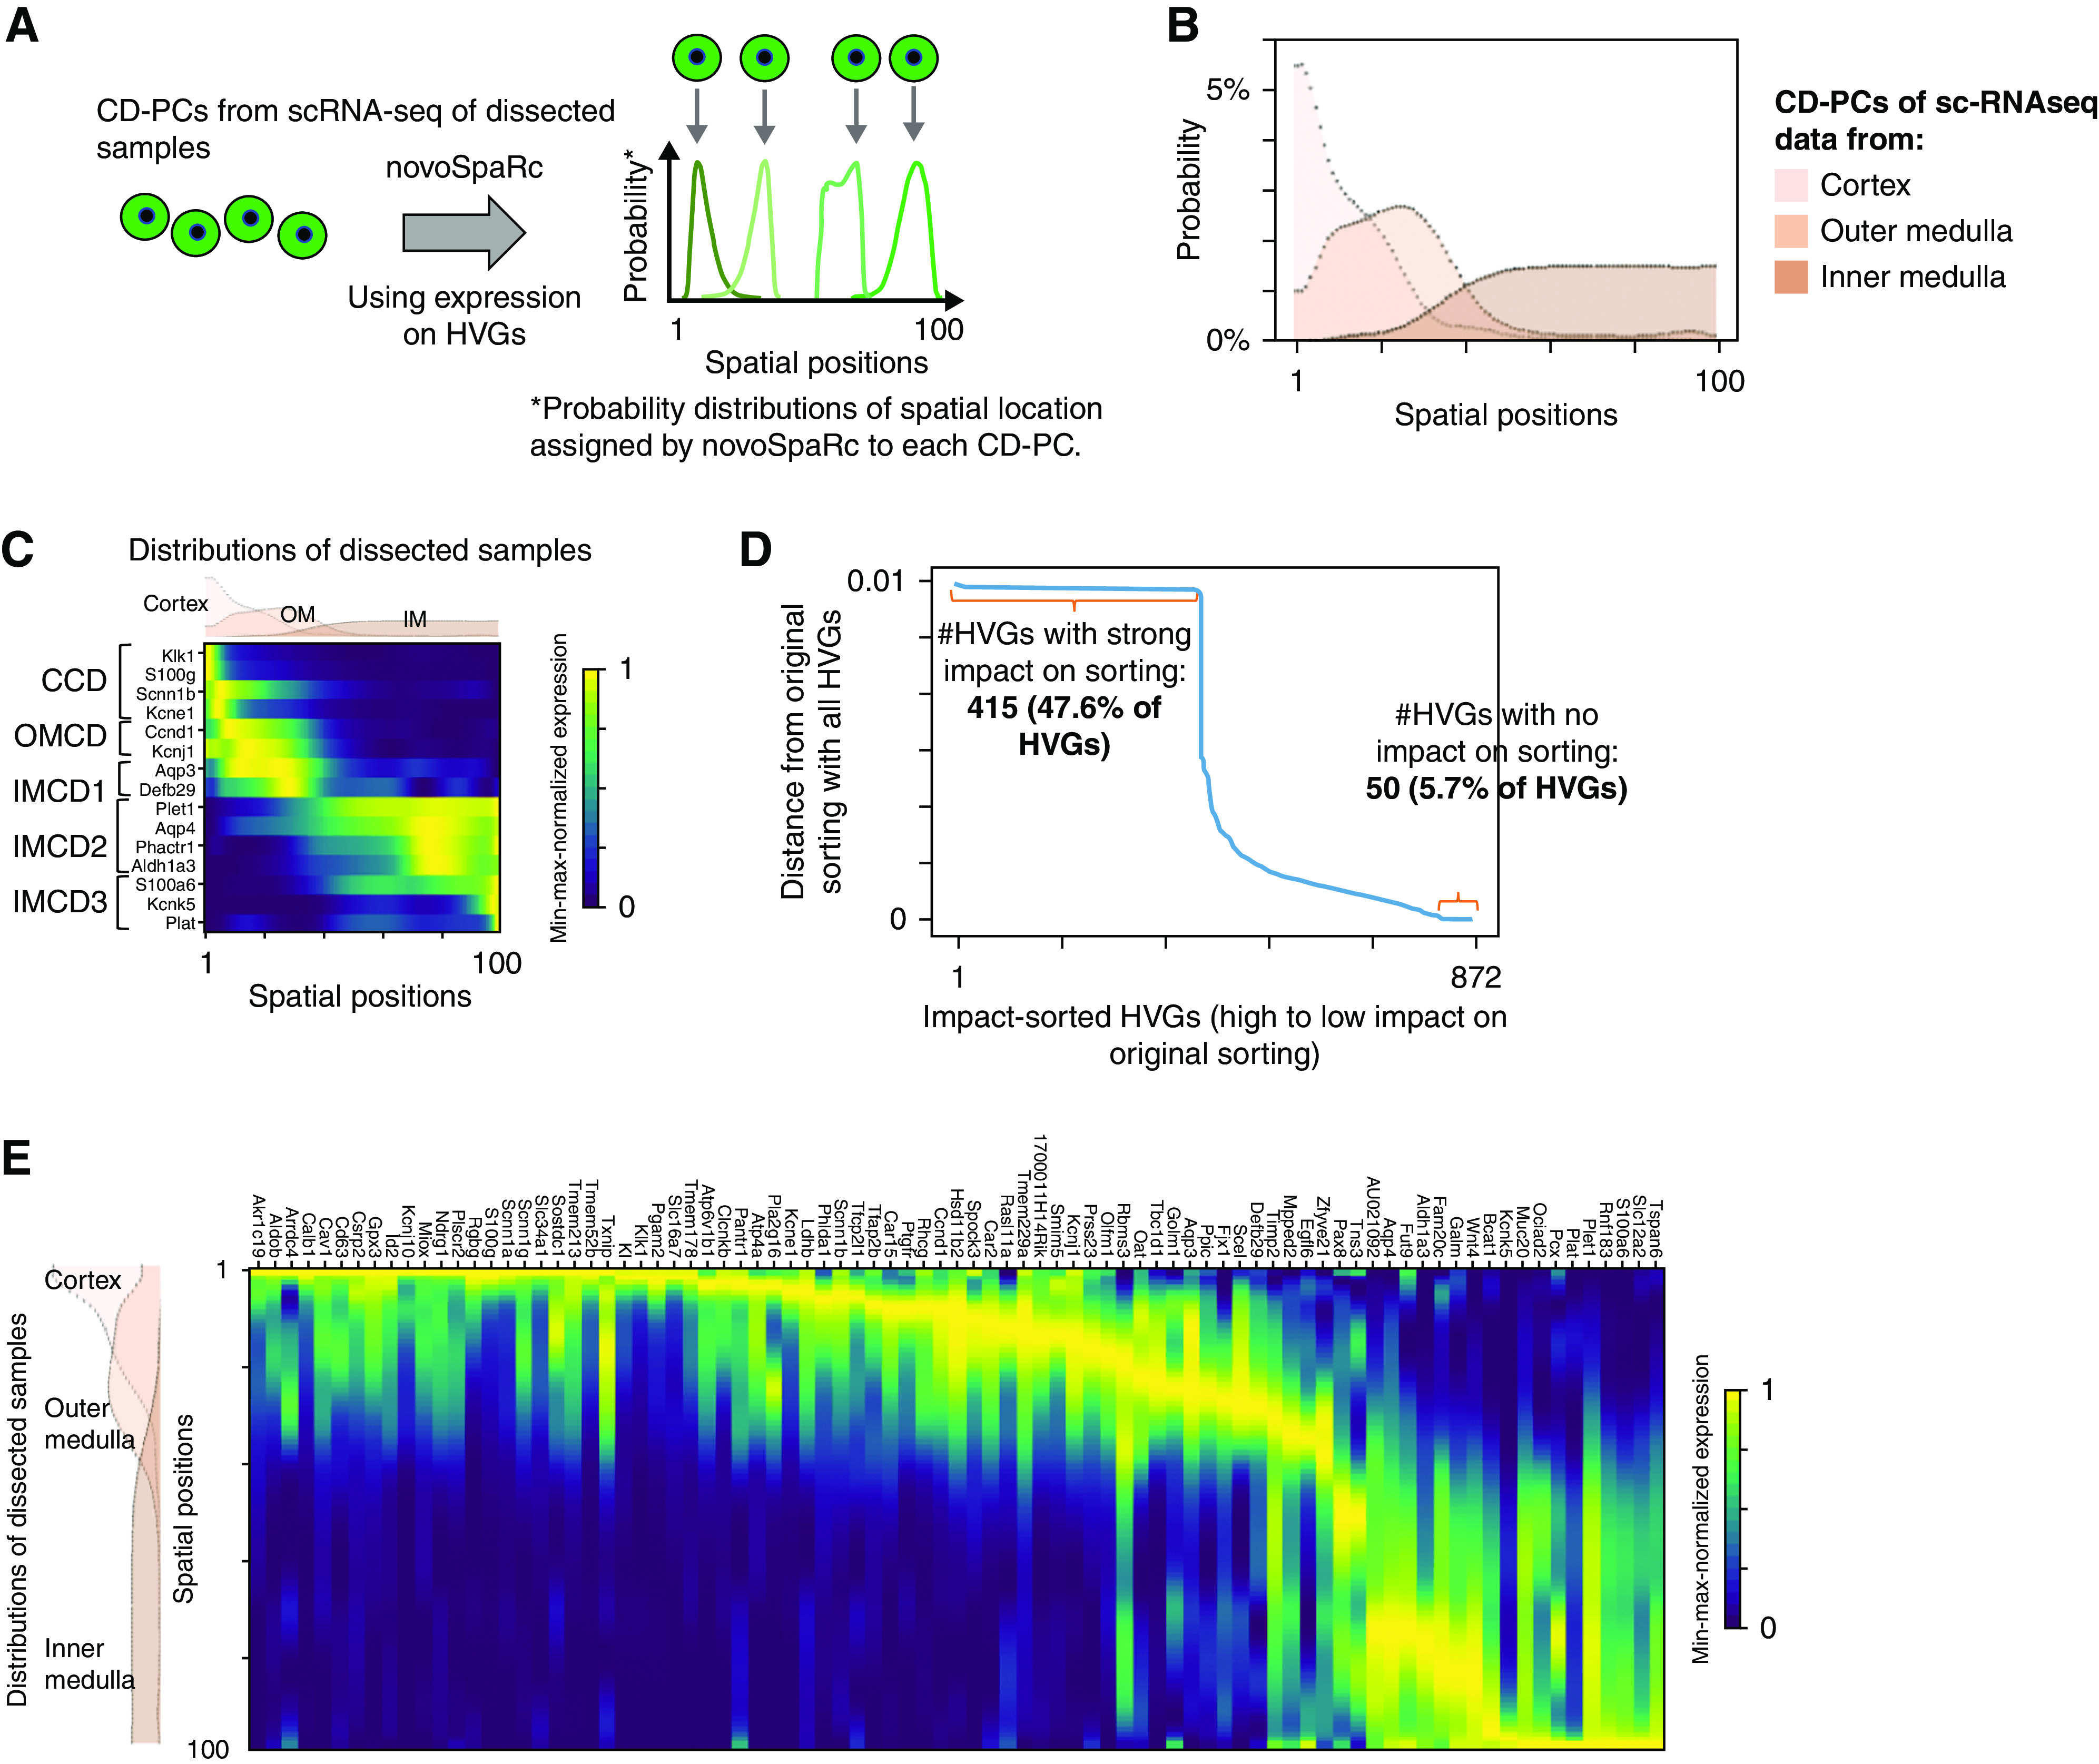
De novo spatial sorting of CD-PCs identifies a continuous transition of gene expression states along the corticomedullary axis. (A) NovoSpaRc assigns each cell a probability distribution for its spatial location on a given space on the basis of gene expression. Scheme for spatial ordering of CD-PCs using novoSpaRc and HVGs. Four hypothetical CD-PCs are shown. Each cell is assigned an individual spatial probability distribution on the basis of HVG expression. The location of maximal probability is indicated by an arrow. In our case, the given space for novoSpaRc to place cells was one dimensional with 100 spatial positions. (B) NovoSpaRc sorting of CD-PCs using HVGs correctly sorts cells derived from the cortex, outer medulla, and inner medulla. Results of joint sorting of CD-PCs from dissected samples (cortex, outer medulla, inner medulla) using 872 HVGs (CD-PC–specific HVGs). The panel shows the joint probability distribution functions for spatial location of all cortical, outer, and inner medullary CD-PCs along the spatial axis, separately, on the provided 100 spatial positions (positions 1–100). (C) NovoSpaRc sorting of CD-PCs correctly predicts known marker gene expression along the corticomedullary axis. Spatial expression analysis from in silico predictions of known CD-PC sub-cell type marker genes produced an expected distribution. The spatial probability density functions for the cortex, outer medulla, and inner medulla as shown in (B) are depicted above the heatmap. (D) NovoSpaRc sorting of CD-PCs depends on most of the HVGs. To analyze the effect of each individual HVG on sorting of CD-PCs from dissected scRNA-seq data, novoSpaRc sorting was performed iteratively by excluding one HVG at a time. We then compared the resulting sorting matrix (probability distributions for each cell) to the original sorting matrix, which was generated using the full set of HVGs. Distance is the Euclidean distance between the two resulting sorting matrices. Genes (872 CD-PC HVGs) were sorted according to the effect on sorting upon exclusion. (E) Spatial gene expression analysis of sorted CD-PCs predicts smooth transition of gene expression from cortical to inner medullary CD-PCs. Heatmaps show expression of regionally restricted genes sorted by their location of maximum expression in our scRNA-seq data from dissected samples. Genes were selected by expression thresholds and maximum-to-background ratio (Supplemental Methods). The displayed genes show a comparable spatial expression pattern in an independent second dataset5 (Supplemental Figure 5C). Gene expression values were min-max normalized per gene.
