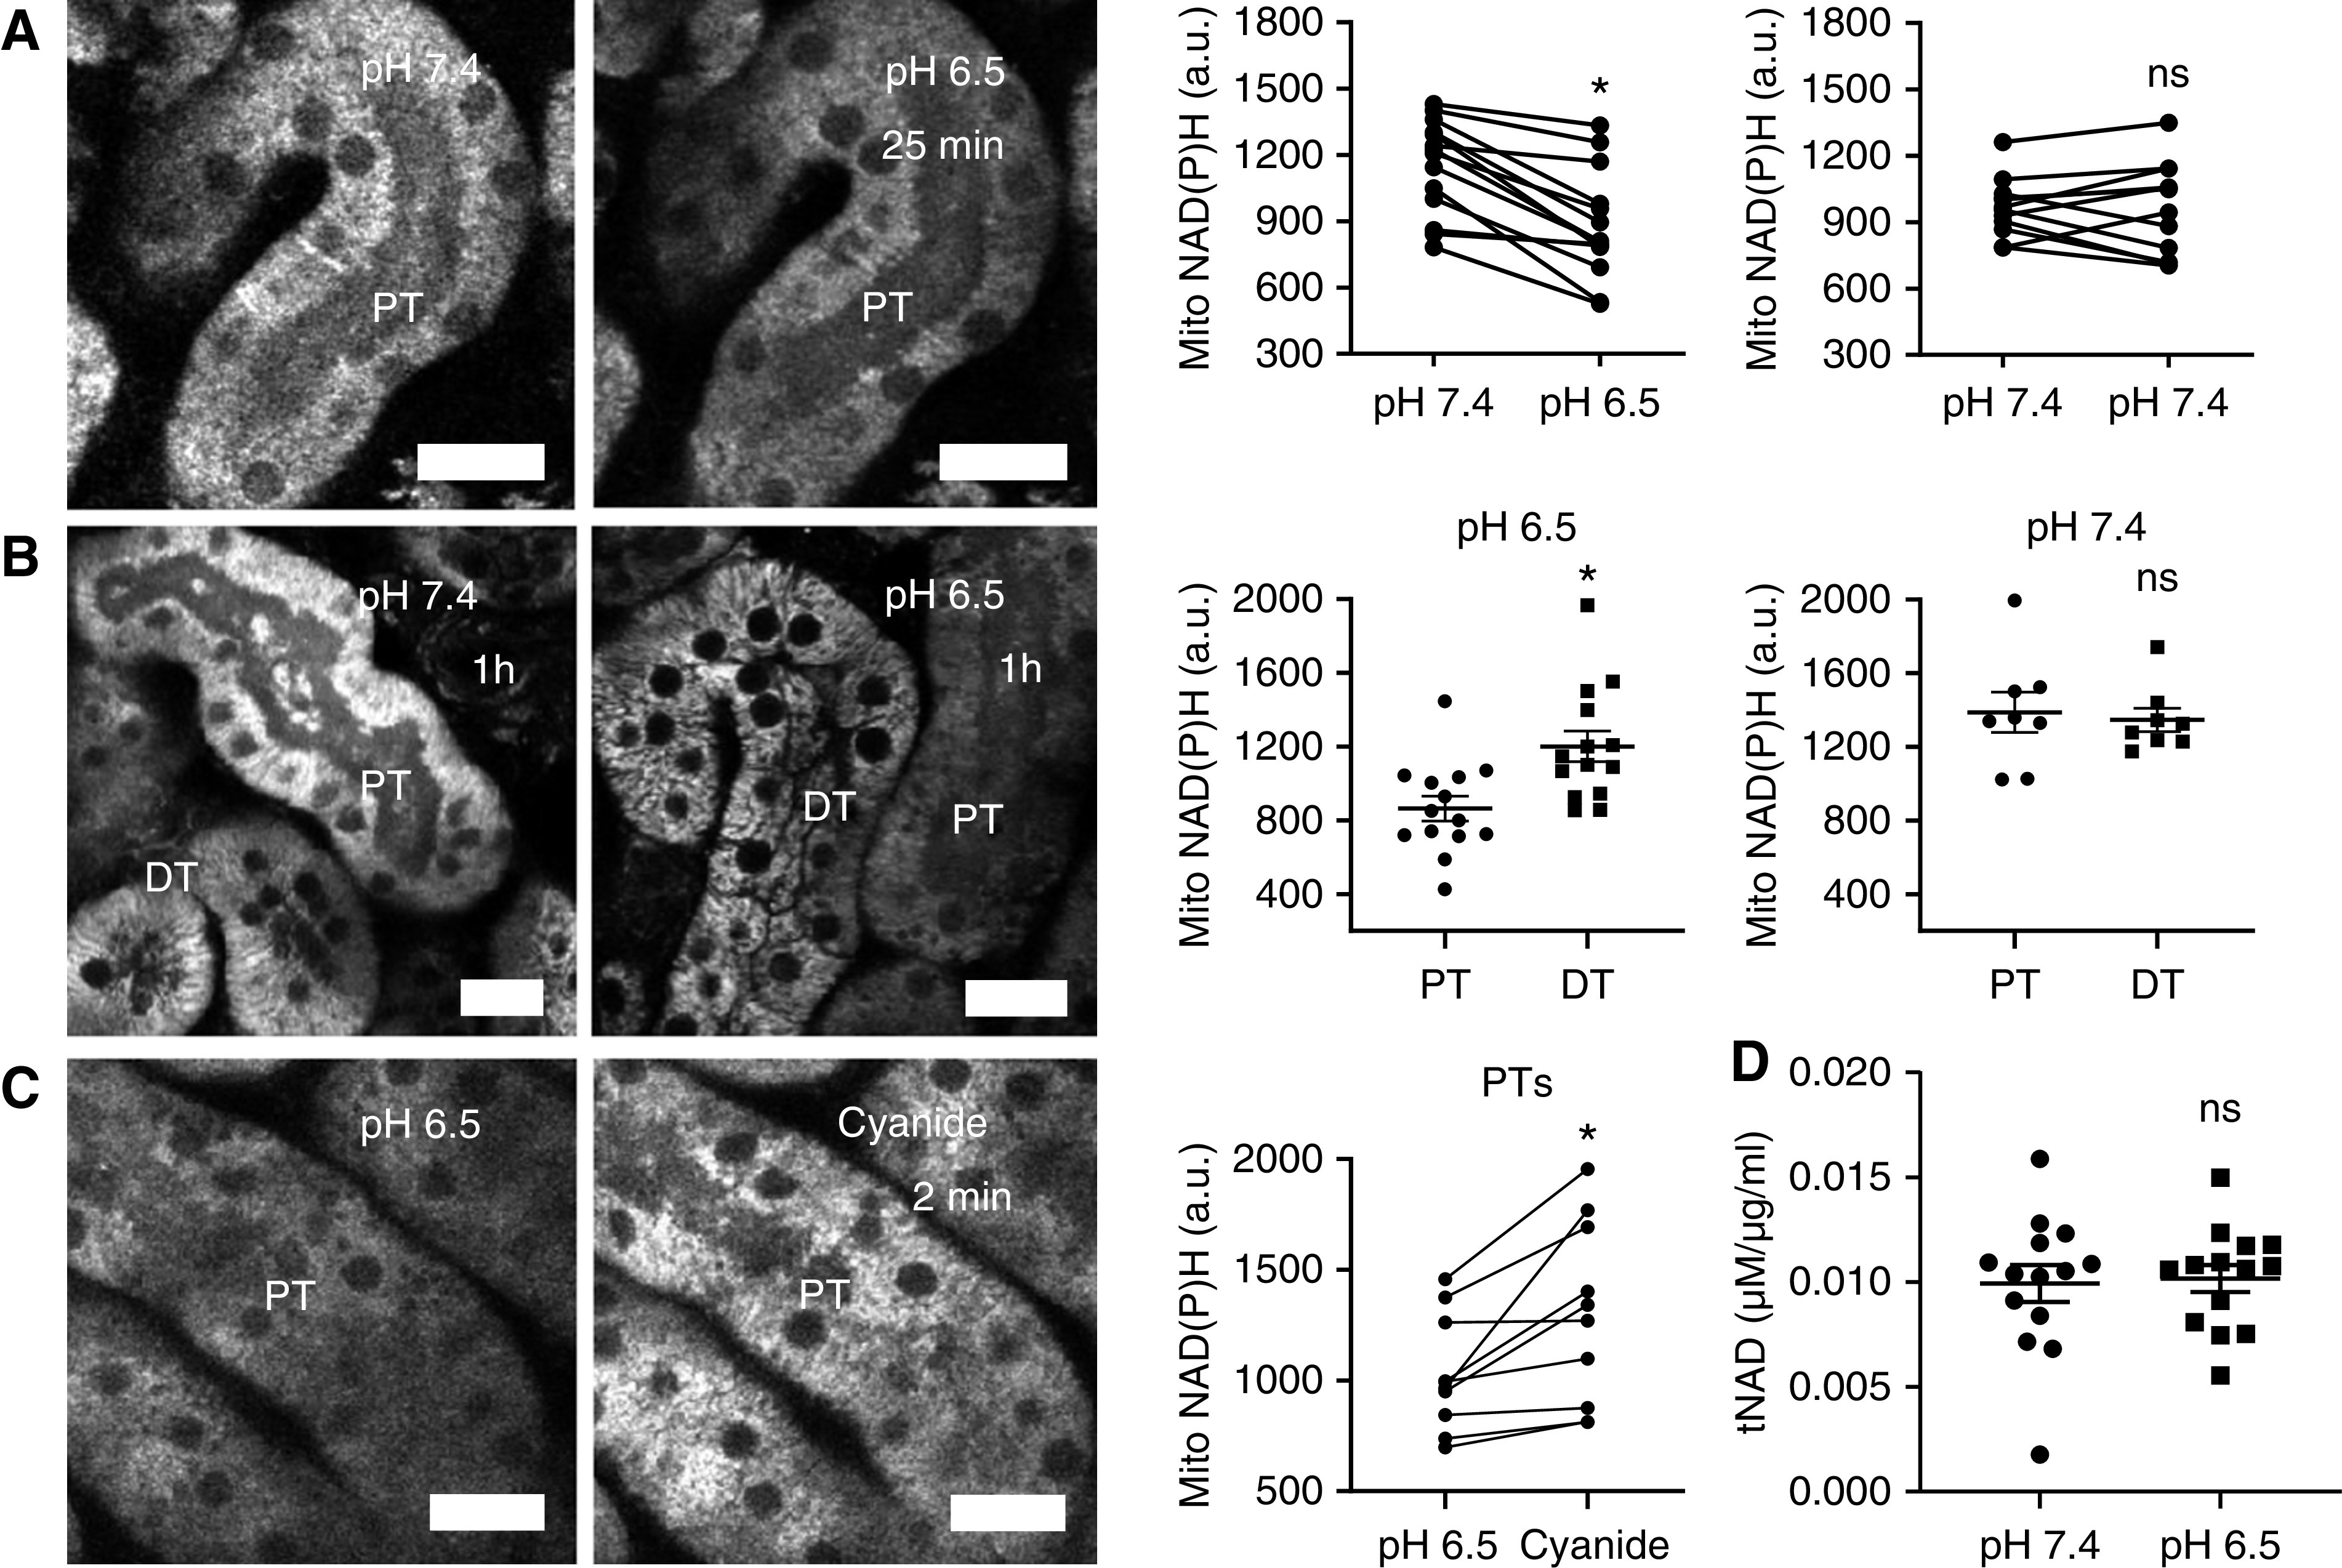
Figure 1.

Acidosis drives NAD redox changes in the PTs. (A) Mitochondrial NAD(P)H signal in the PT decreased in response to acute acidosis. Data are presented as fluorescence intensity values before and 25 minutes after change of buffer with pH 6.5 or 7.4 (n=12–14 PTs from three to five kidney slices from three to four different animals). P<0.01 for pH 7.4 versus pH 6.5, and P=0.9 for pH 7.4 versus pH 7.4 after paired t tests. (B) After 1 hour of incubation at pH 6.5, NAD(P)H signal in PTs was lower than in distal tubules (DTs). Data are presented as fluorescence intensity values after incubation in pH 7.4 or pH 6.5 buffer (n=8–14 PTs from six to seven kidney slices from six different animals). P<0.01 for PT versus DT at pH 6.5, and P=0.9 for PT versus DT at pH 7.4 after unpaired t tests. (C) After 1 hour of acidosis, inhibiting the RC with cyanide (5 mM) caused an abrupt increase in mitochondrial NAD(P)H signal. Data are presented as fluorescence intensity values before and after cyanide (n=10 PTs from five kidney slices from four different animals). P<0.05 for pH 6.5 versus cyanide after paired t test. (D) Total NAD levels, measured in control and acid-treated slices after 25 minutes, remained unchanged (n=14 kidney slices from four different animals). P=0.8 for pH 7.4 versus pH 6.5 after unpaired t test. Scale bars = 20 µm. a.u., arbitrary units.
