Figure 2.
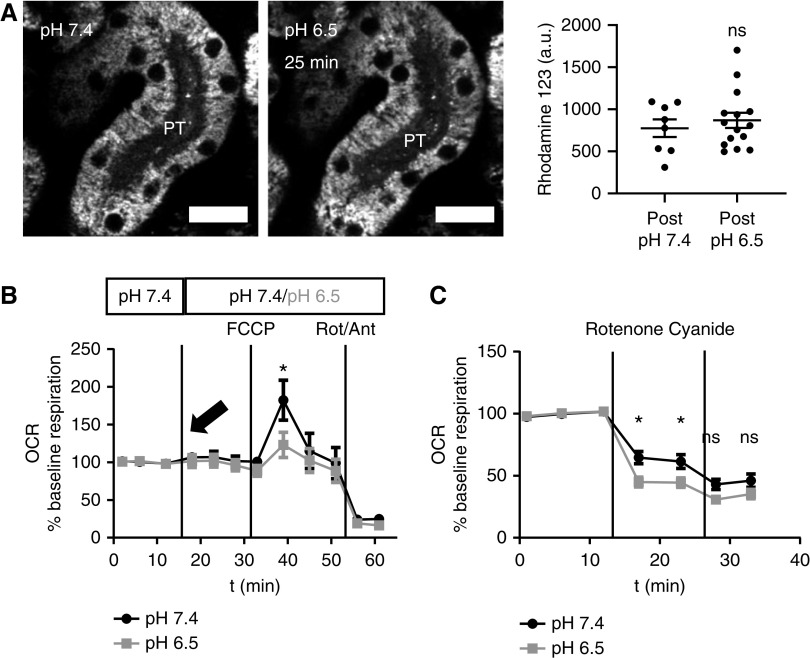
Acidosis induces a switch toward increased complex I activity. (A) Mitochondrial rhodamine 123 signal in the PTs did not change in response to acute acidosis. Data are presented as fluorescence intensity values 25 minutes after changing the pH of the buffer to 7.4 or 6.5 (n=8–14 PTs from four kidney slices from three different animals). P=0.5 for pH 7.4 versus pH 6.5 after unpaired t test. (B) OCR in isolated PTs did not change with acute pH change to 6.5 (arrow); however, maximum respiration capacity, measured using the RC uncoupler carbonyl cyanide-4-(trifluoromethoxy)phenylhydrazone (1 µm), was significantly decreased in PTs exposed to acidic pH. OCR was normalized to baseline oxygen consumption of each well (n=10 wells per group from four different animals). P<0.05 for pH 7.4 versus pH 6.5 after two-way ANOVA (Tukey’s multiple comparison test). (C) Selective inhibition of complex I with rotenone (1 µm) produced a bigger decrease in OCR in isolated PTs incubated in pH 6.5 than in PTs incubated in pH 7.4 (n=20 wells per group from seven different animals). P<0.05 and P<0.01 for pH 7.4 versus pH 6.5 after two-way ANOVA (Tukey’s multiple comparison test). Complete blockade of RC function with cyanide (2 mM) decreased OCR in both groups to the same levels. P=0.4 and P=0.6 for pH 7.4 versus pH 6.5 after two-way ANOVA (Tukey’s multiple comparison test). Scale bar = 20 µm. a.u., arbitrary units.

