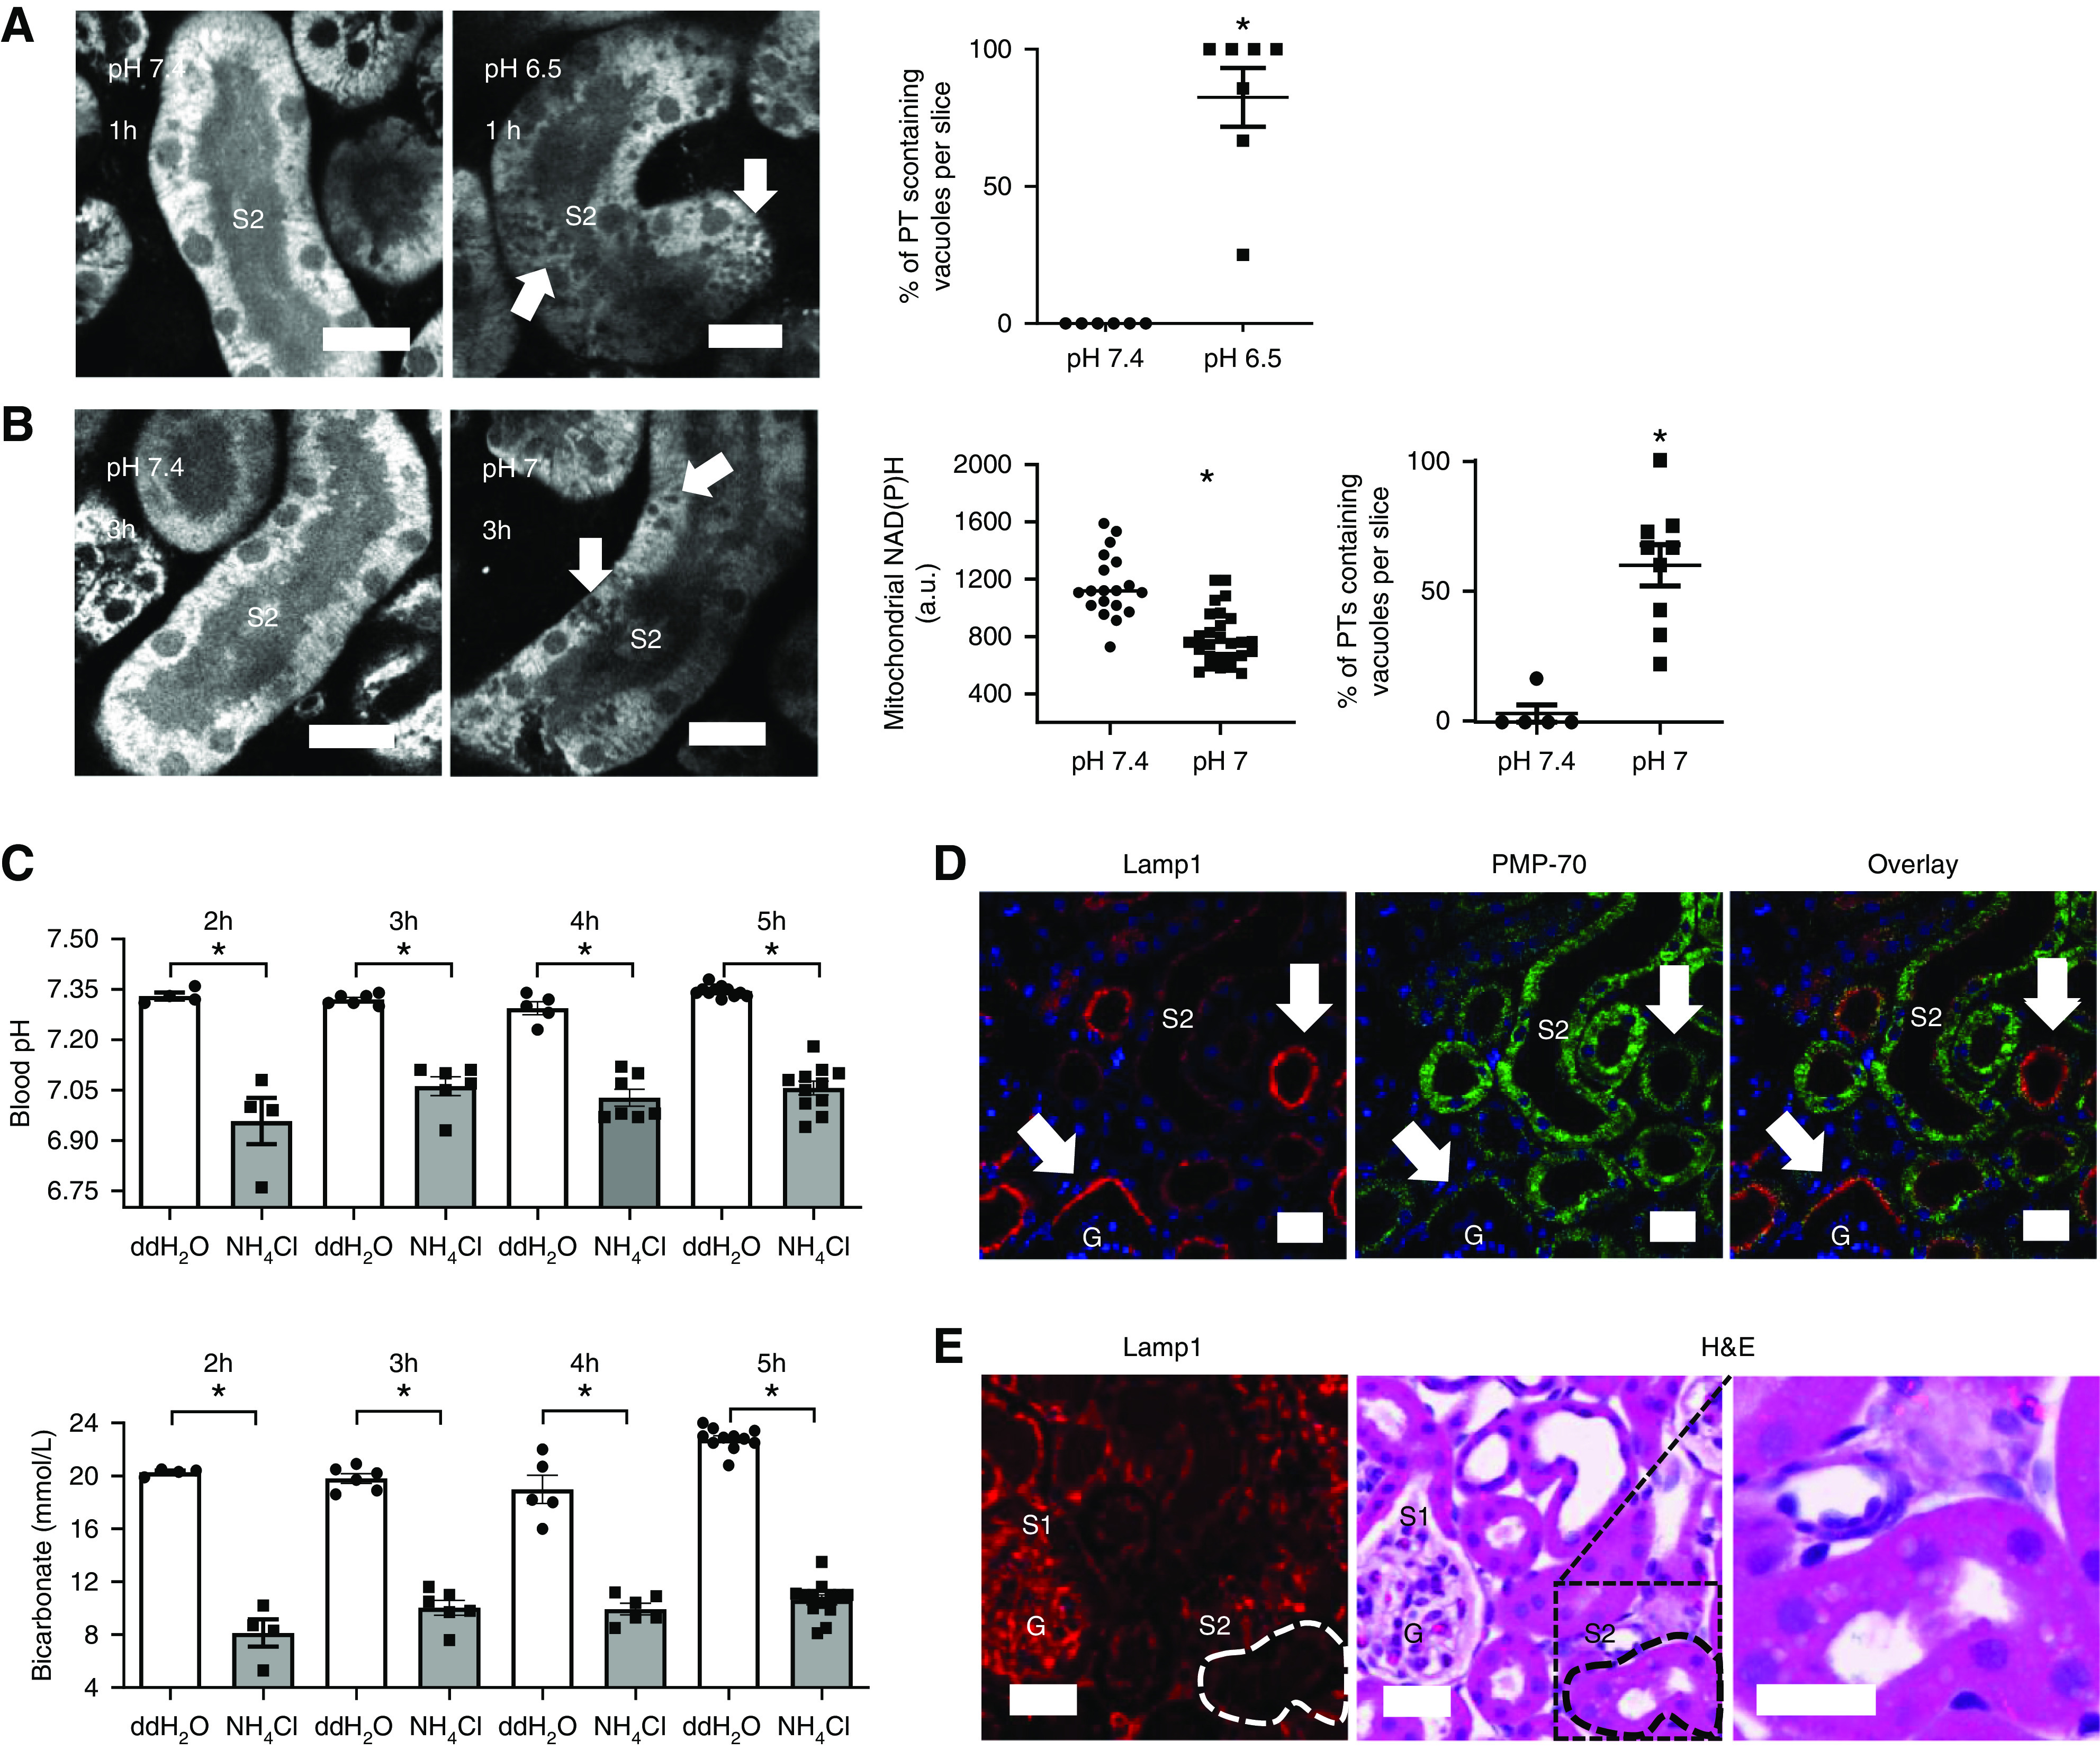
Figure 3.

Acidosis induces the appearance of vacuoles in the PT. (A) Live imaging of NAD(P)H signal in kidney slices, showing the appearance of vacuoles (arrows) in S2 segments of PTs after 1-hour incubation in pH 6.5 (n=6–7 different slices from five different animals). P<0.01 for pH 7.4 versus pH 6.5 after Mann–Whitney U test. (B) Mitochondrial NAD(P)H signal was significantly lower in PTs incubated at pH 7 for 3 hours when compared with controls. Data are presented as fluorescence intensity values after incubation in pH 7.4 or pH 7 buffer (n=19–27 PTs from five to eight kidney slices from four different animals). P<0.01 for pH 7.4 versus pH 7 after unpaired t test. Vacuoles (arrows) were also observed after 3 hours of incubation at pH 7 (n=5–8 different slices from four different animals). P<0.01 for pH 7.4 versus pH 7 after Mann–Whitney U test. (C) Blood pH and blood bicarbonate concentration, measured in animals 2, 3, 4, and 5 hours after acidosis was induced with 1.5 M NH4Cl, were significantly lower in comparison with control-treated animals (double-distilled (dd) H2O) (n=4–11 animals per group). Blood pH and bicarbonate (for all of the timepoints): P<0.01 for double-distilled (dd) H2O versus NH4Cl after unpaired t tests. (D) Antibody staining for the lysosomal marker LAMP1 and peroxisome-specific antibody PMP-70 was used to identify S1 (arrows) and S2 PT segments, respectively, in fixed kidney tissue. (E) Hematoxylin and eosin (H&E)-stained tissue 5 hours after induction of acidosis, showing vacuoles in PT segments, identified as S2 by a low LAMP1 signal. Scale bars = 20 µm. G, glomerulus.
