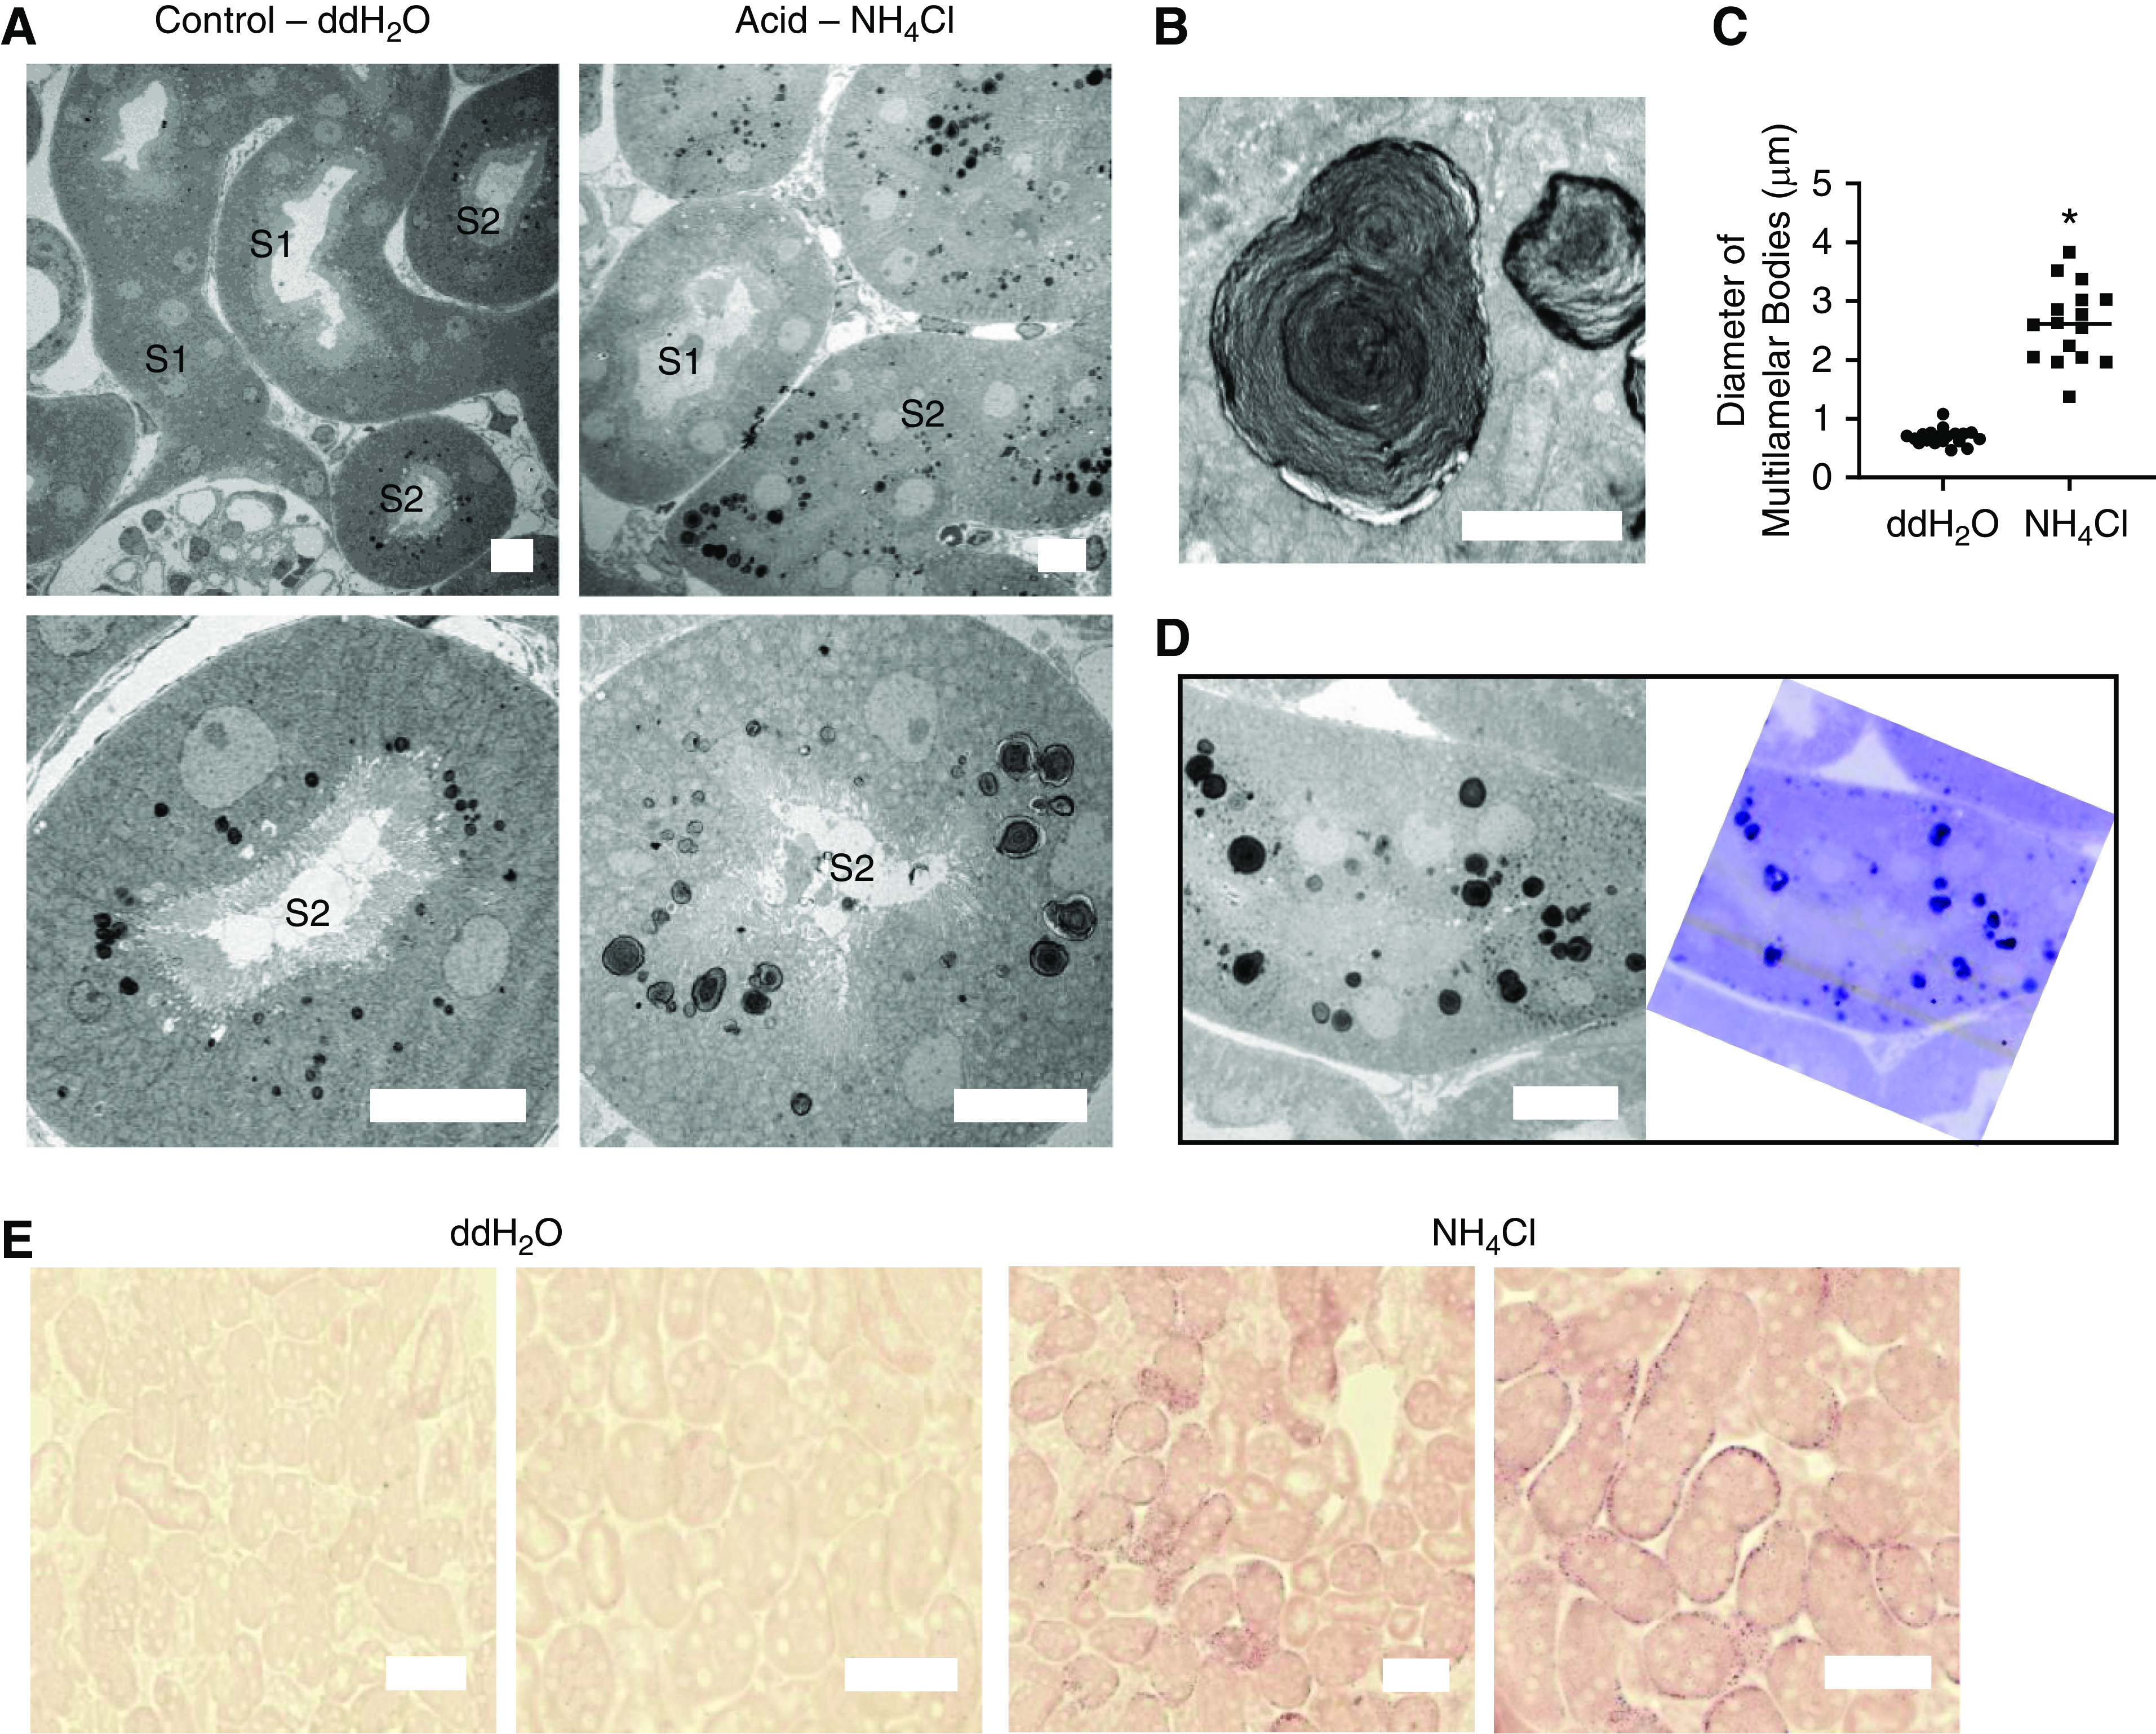
Figure 4.

Acidosis causes changes in PT lipid metabolism. (A) EM images of PTs 5 hours after gavage, showing enlargement of MLBs in S2 segments of acid-fed mice. Scale bars = 10 µm. (B) Zoomed-in images of MLBs, demonstrating the whirl-like structure. Scale bar = 2 µm. (C) Measurement of diameter of MLBs in control- and acid-treated animals (n=16–19 MLBs from three different areas from five different animals). P<0.01 for double-distilled (dd) H2O versus NH4Cl. (D) Corresponding EM (left) and toluidine blue–stained (right) images, showing a high phospholipid content of the MLBs. Scale bar = 10 µm. (E) ORO staining intensity 2 hours after gavage was much higher in PTs of acid-fed animals. Scale bars = 50 µm.
