Figure 6.

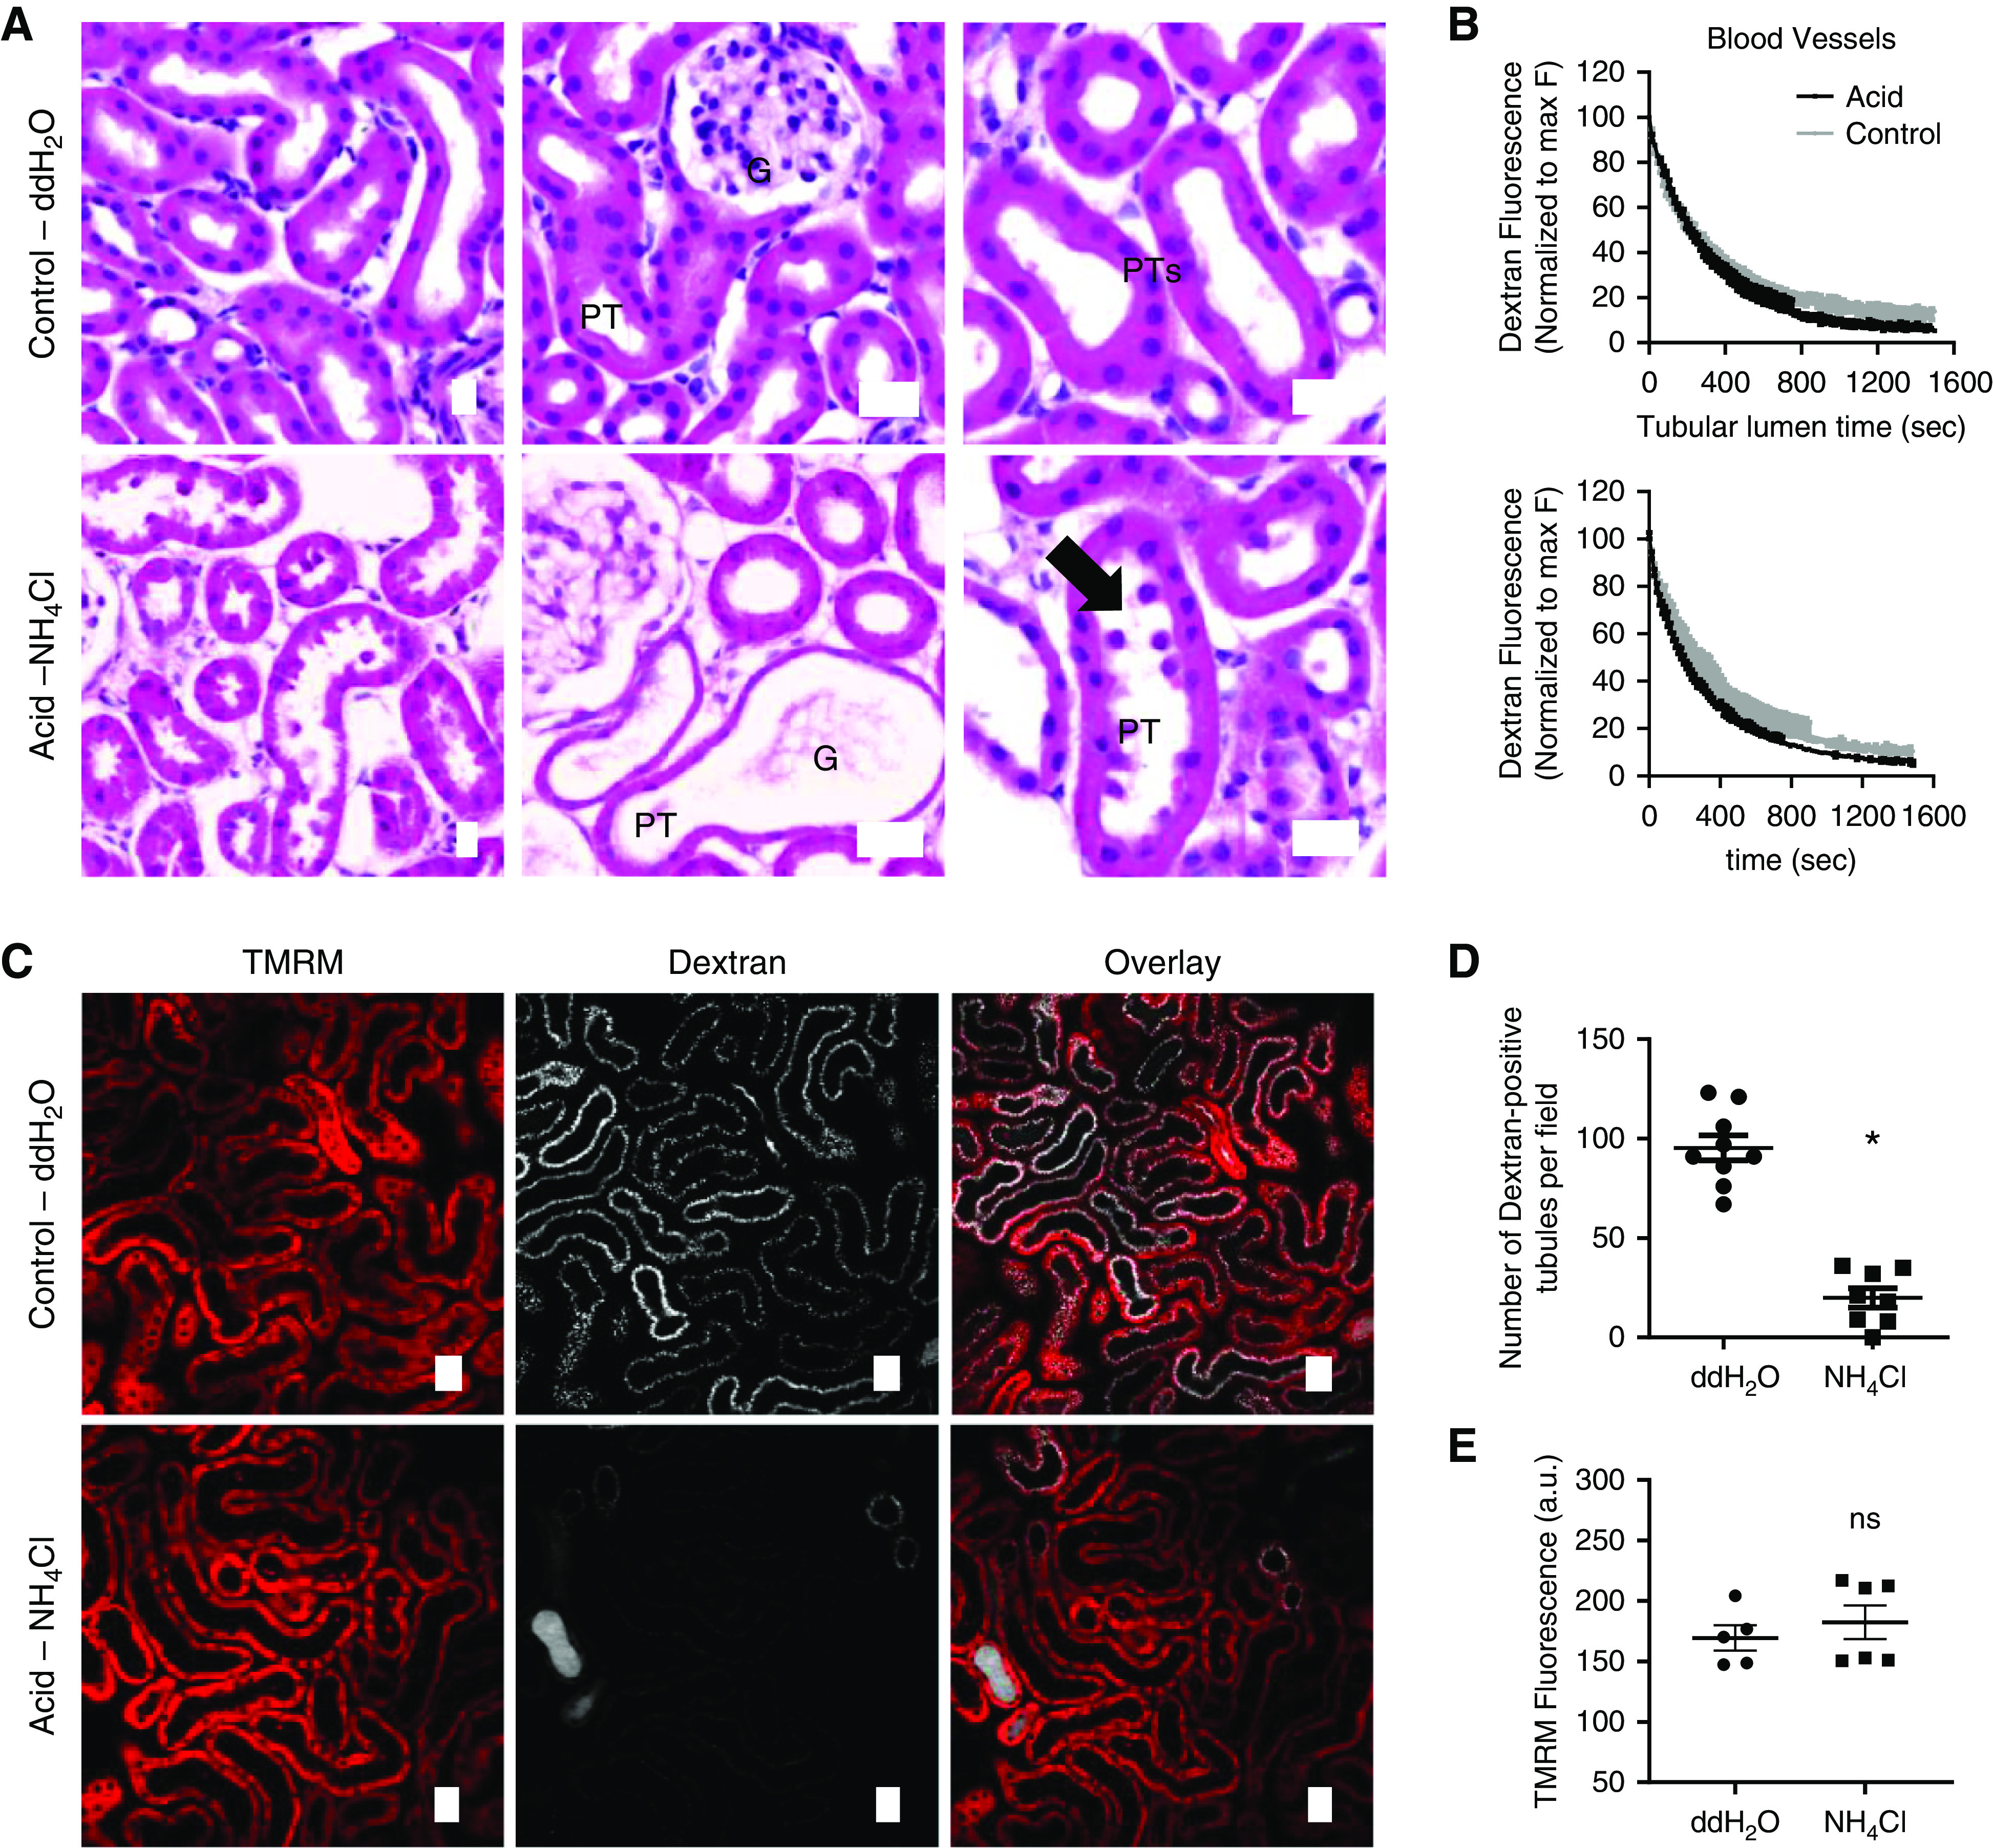
Acidosis induces an AKI phenotype in PTs. (A) Hematoxylin and eosin (H&E) staining in acid-fed mice revealed thinning of PTs and shedding of cellular debris (arrow), consistent with AKI. (B) Dextran fluorescence intensity decay curves, acquired using intravital microscopy, from blood vessels (reflecting GFR) and PT lumens (reflecting luminal flow) did not reveal differences between control and acid-treated animals. Two-phase model fitted well to the entire data points and was the same for both data sets. (C–E) Uptake of filtered dextran in PTs was drastically reduced in acid-treated mice (n=8–9 different areas from three different animals per group; P<0.01 for double-distilled (dd) H2O versus NH4Cl after unpaired t test), whereas the PT mitochondrial TMRM signal did not differ from control animals (n=6 different areas from three different animals per group; P=0.5 for ddH2O versus NH4Cl after unpaired t test). Scale bars = 20 µm. a.u., arbitrary units; G, glomerulus.
