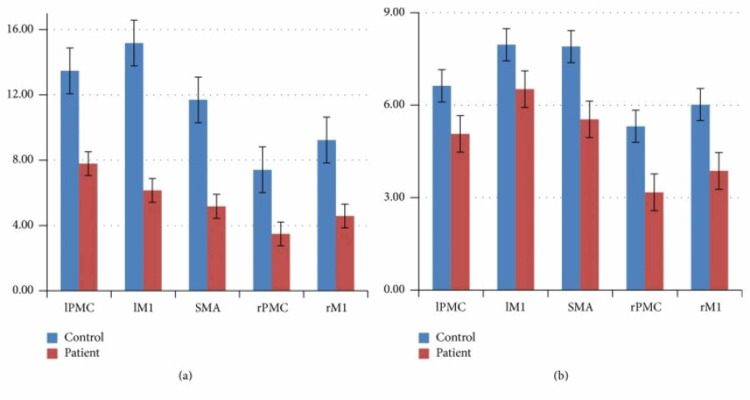
Figure 1. The statistical analysis of the mean value of the highest positive t value of the subject-specific ROI in the two groups, (a) motor execution; (b) motor imagery.
Source: Wang et al. [20]
IPMC: left premotor cortex; lM1: left primary motor cortex; SMA: supplementary motor area; rPMC: right premotor cortex; rM1: right primary motor cortex; ROI: region of interest

