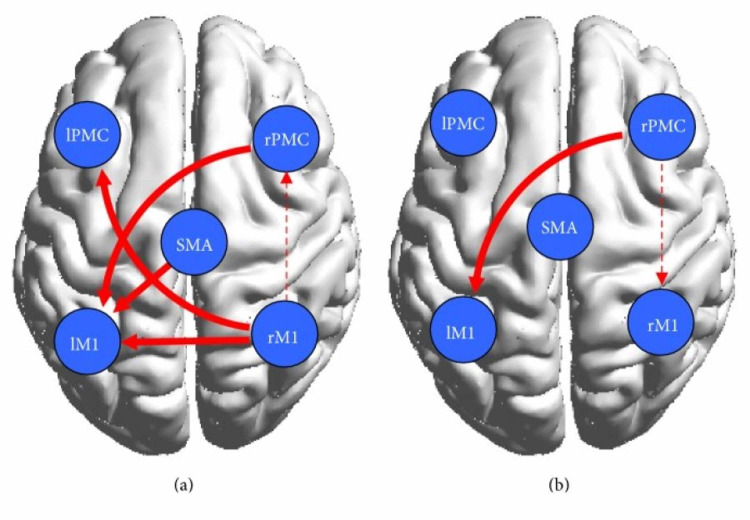
Figure 5. Results of the motor network causal interactions in the controls versus the stroke patients during ME and MI.
Solid lines indicate significantly stronger connections in the control group than in the patient group, and dashed lines indicate the opposite according to Wang et al. [20].
ME: motor-execution; MI: motor imagery; IPMC: left premotor cortex; lM1: left primary motor cortex; SMA: supplementary motor area; rPMC: right premotor cortex; rM1: right primary motor cortex

