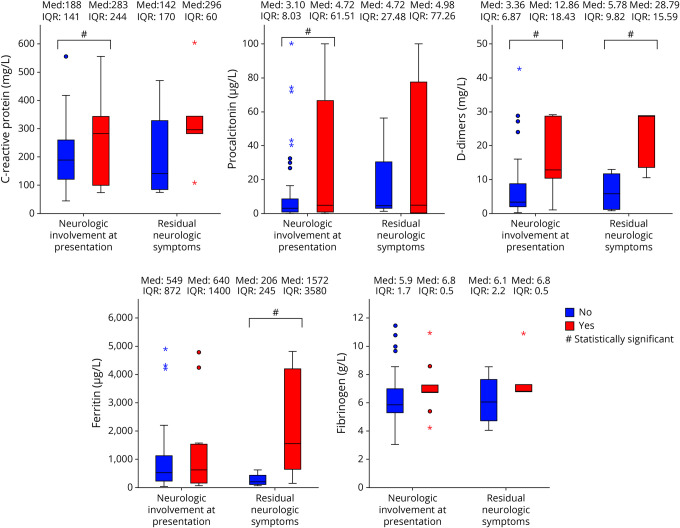
Figure 2. Box Plot Graphs Comparing Highest Pretreatment Mean Inflammatory Markers.
Box plot graphs comparing highest mean inflammatory markers. Left side of each plot: comparison of PIMS-TS patients (n = 75) without (blue, n = 66) and with (red, n = 9) neurologic involvement during acute illness. Right side of each plot: comparison of PIMS-TS patients with neurologic involvement at presentation (n = 9) without (blue, n = 4) and with (red, n = 5) neurologic residual symptoms at 3-month follow-up. Asterisks denote outliers >3 times the interquartile range (IQR). PIMS-TS = pediatric inflammatory multisystem syndrome temporally associated with SARS-CoV-2.

