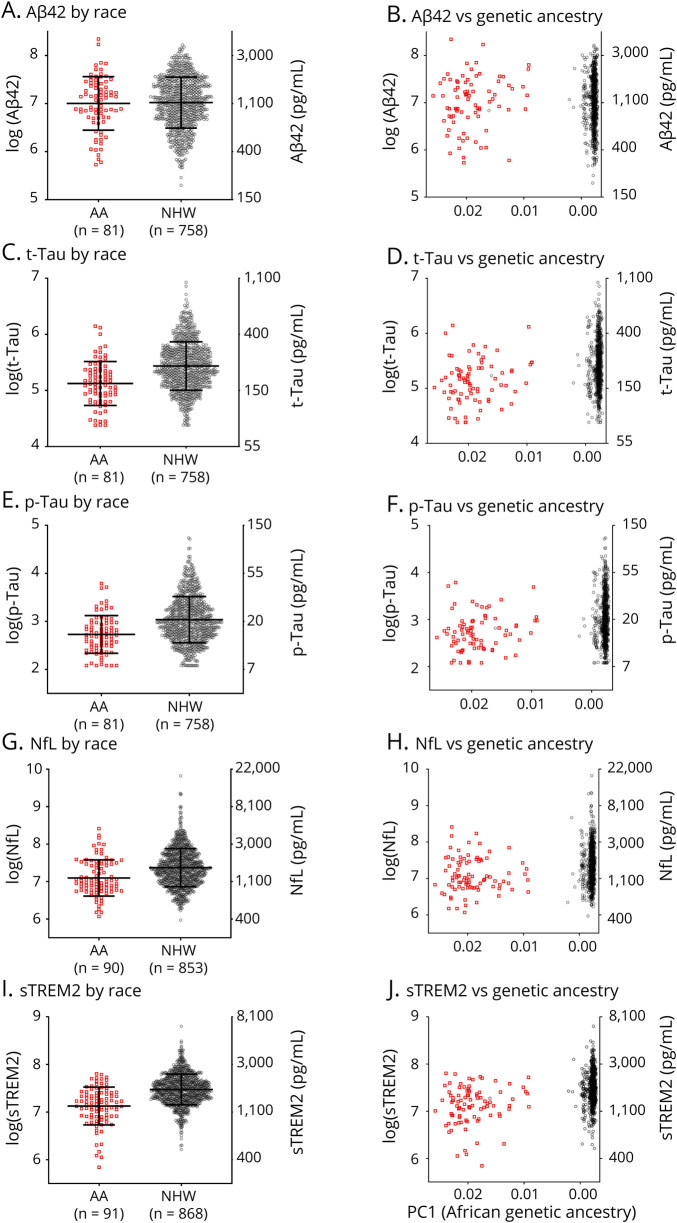
Figure 1. Differences in CSF Biomarker Concentrations by Self-Reported Race.
The natural logarithm of CSF concentrations of amyloid-β 42 (Aβ42, A, B), total tau (tTau, C, D), phosphorylated tau 181 (pTau, E, F), neurofilament light chain (NfL, G, H), and soluble triggering receptor expressed on myeloid cells 2 (sTREM2, I, J) was plotted as a function of self-reported race (African American [AA] or non-Hispanic White [NHW]) or a measure of African genetic ancestry (PC1, higher values correspond to higher African genetic ancestry, axis is reversed). Corresponding concentrations in pg/mL are shown on the right axis. Red squares represent samples from AAs, and gray circles represent samples from NHWs. The number of individuals in each group is listed (n).

